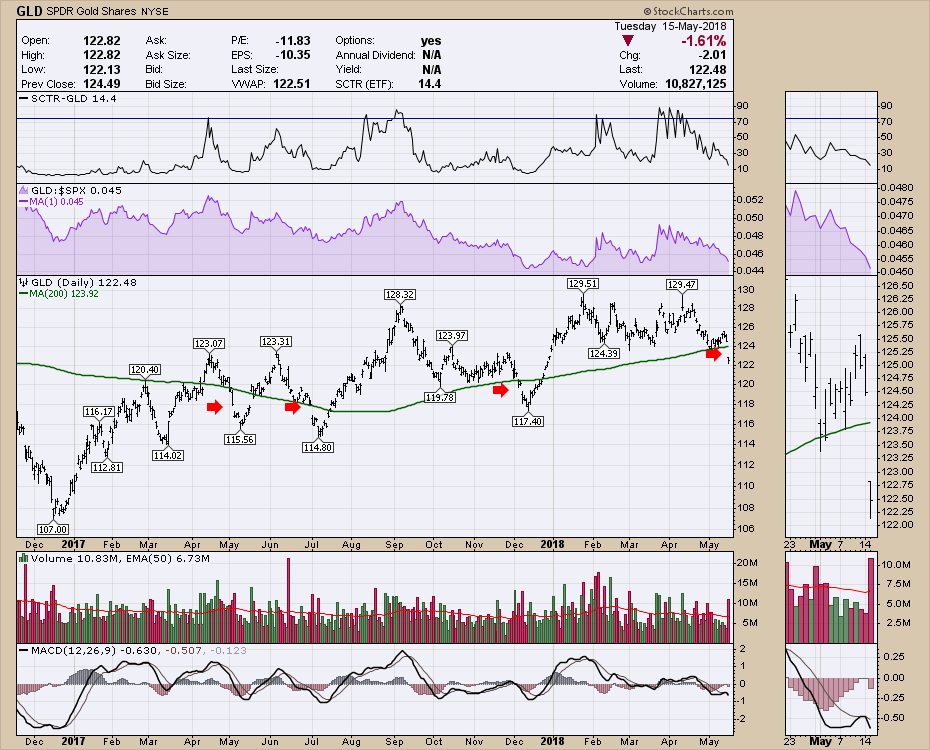
The Gold chart gapped below the 200 DMA again today. This is the fourth time in the last year. However, look at the trend after the gap down below the green moving average line. Approximately one week later, Gold reversed and started a long up trend in the three previous cases.
 If that is going to work again, we should see a bottom formation early next week.
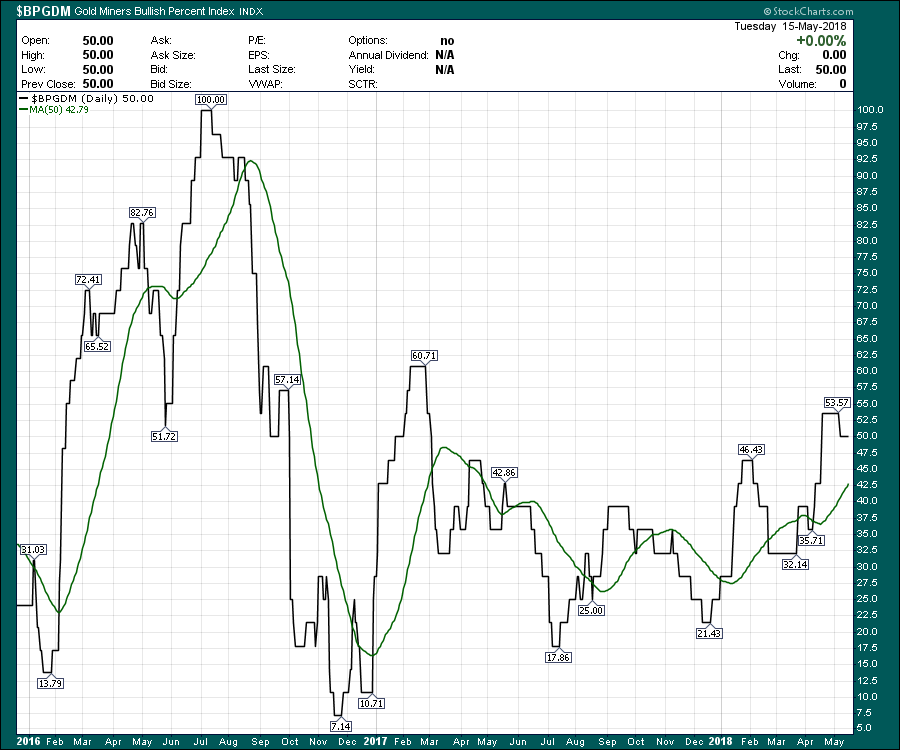
Below is the Bullish Percent Index for the gold miners. It was starting to look very bullish by rising above 50%. We'll see if we get a pullback.
 I am watching closely to see if this transpires because the industrial metals stocks were starting to perk up until the $USD soared today. Sometimes the industrial metal miners can be a clue.
Good trading,
Greg Schnell, CMT, MFTA


