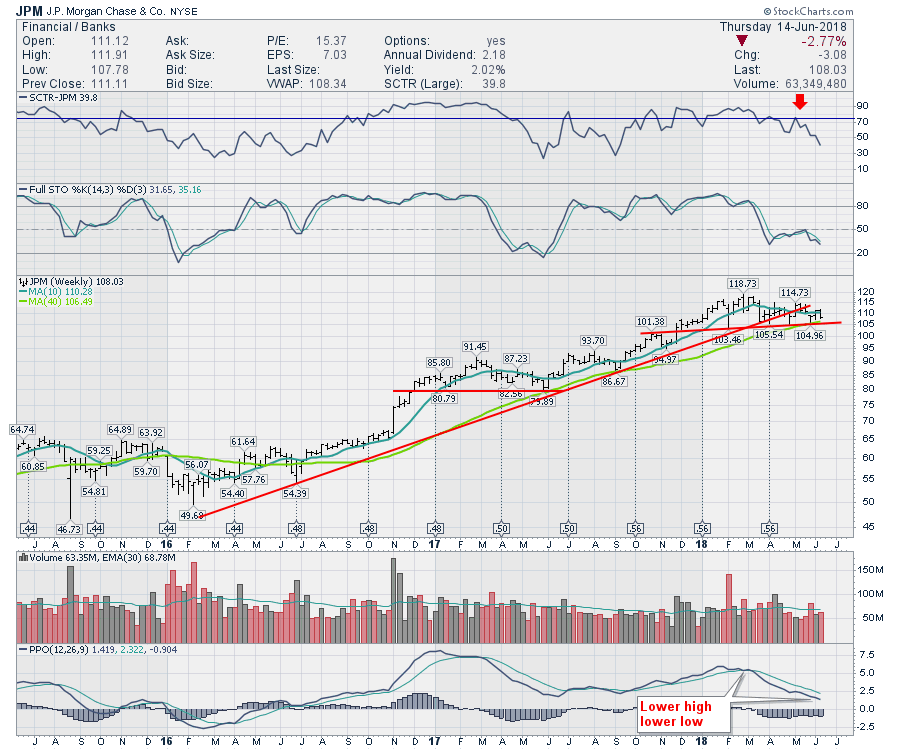
JPM has been drifting lower since March 2018. While it is still about the 40 week moving average, it is definitely not one of the stronger stocks out there. The SCTR has dropped to 40, which is near the lowest levels on the chart. While there is a topping structure on the chart, the question approaching is: Will the neckline hold?
Interestingly enough, JPM had almost the identical chart pattern set up a year ago. After the stock broke below 82 in late may 2017, it started a steely surge that saw the stock move 50% in 8 months!
So what is an investor to do now? The right answer is tread cautiously. The PPO momentum indicators are making lower highs and lower lows now. The price has also broken the big two year up trend. While I am confident JPM will remain one of the strongest banks out there, its hard to own when it keeps pulling back.

Have a good Father's Day weekend and enjoy the World Cup and the US Open!
Good trading,
Greg Schnell, CMT, MFTA
Senior Technical Analyst, StockCharts.com
Book: Stock Charts for Dummies
Twitter: Follow @Schnellinvestor
