 Oil fell rather sharply over the last two weeks, but the long-term trend is up and two technical indicators point to a bounce.
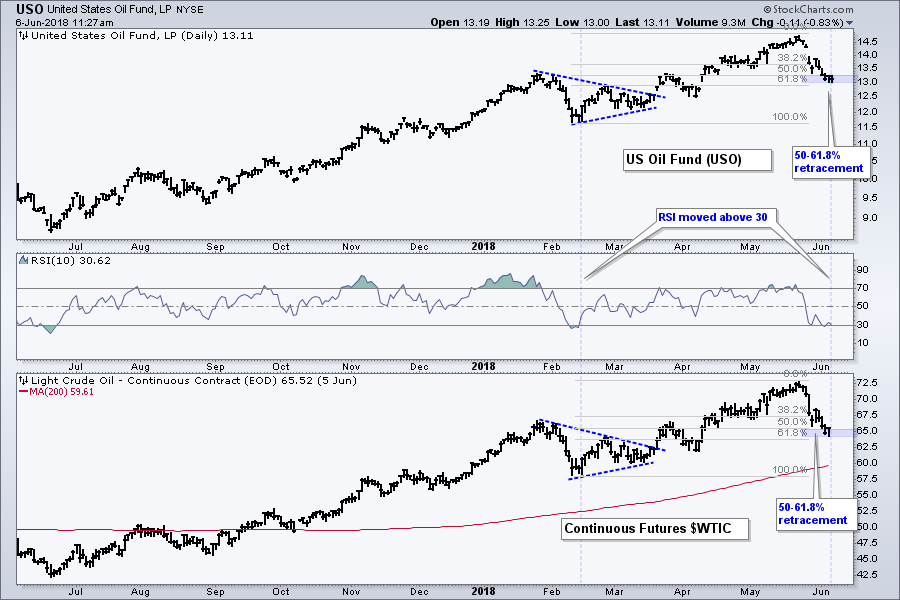
The chart below shows the USO Oil Fund (USO) in the top window, RSI for USO in the middle and the Light Crude Continuous Contract ($WTIC) in the lower window. USO is fine for short-term analysis, but I prefer $WTIC for long-term analysis.
First and foremost, the long-term trend is up as crude advanced from the mid 40s in June 2017 to the low 70s in May. Oil hit a 52-week high in May and remains well above its rising 200-day SMA.
Short-term, USO retraced 50-61.8% of the February-May advance with a decline back to the 13 area. Such a retracement can be part of a two-steps forward and one-step backward process (a.k.a. an uptrend). The indicator window shows RSI(10) becoming oversold for the second time this year. The February oversold reading coincided with a short-term bottom.
Overall, oil is oversold, trading in a retracement zone and within a long-term uptrend. This is a recipe for a short-term reversal so I would watch closely for an upside catalyst, such as a break above 13.5 in USO.
On Trend and Youtube Channel
On Trend is my show on StockCharts TV. Available to everyone, this show airs every Tuesday at 10:30 AM and is then archived on our Youtube Channel.
Highlights from On Trend for Tuesday, June 5th
- 40 Years of the S&P 500
- Broad Market AD Lines Record New Highs
- 52-week Highs Expand in Two Key Sectors
- Retail Propels Consumer Discretionary Sector
- Copper and COPX Bounce off Support (plus PALL)
- Stocks: QLYS, PFPT, FEYE, CY, LRCX, ON, AKAM, VAR
Plan Your Trade and Trade Your Plan.
- Arthur Hill, CMT
Senior Technical Analyst, StockCharts.com
Book: Define the Trend and Trade the Trend
Twitter: Follow @ArthurHill


