 I do not use bullish and bearish divergences with momentum indicators very often because they usually form in the direction of the bigger trend. For example, most bearish divergences form in uptrends and most bullish divergences form in downtrends. I trade in the direction of the bigger trend and prefer to ignore such divergences.
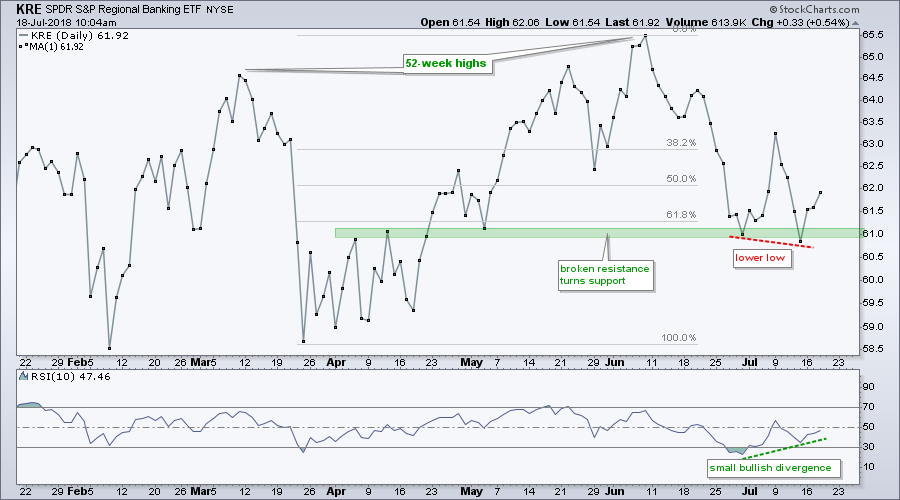
The Regional Bank SPDR (KRE) fits my divergence criteria because it is in a long-term uptrend. The long-term trend is up because the ETF recorded 52-week highs in mid-March and mid-June, and the 50-day EMA is above the 200-day EMA (not shown).
A small bullish divergence occurred because the ETF formed a lower low from late June to mid-July and the indicator formed a higher low. Also notice that RSI held above 30 with last week's dip and this means a bullish failure swing could also be forming.
Returning to the price chart, this is also a good spot for a price reversal. Notice that the decline into mid-July retraced around 2/3 of the prior advance and returned to the breakout zone (61). Broken resistance turns support and 2/3 is the maximum retracement expected for a correction.
In short, it looks like the pullback is ending and the bigger uptrend is taking over again. This projects a move to new highs in the coming weeks.
On Trend on Youtube
Available to everyone On Trend with Arthur Hill airs Tuesdays at 10:30AM ET on StockCharts TV and repeats throughout the week at the same time. Each show is then archived on our Youtube channel.
Topics for Tuesday, July 17th:
- Index New Highs Still Dragging, but Net Bullish
- Tech, Staples and Healthcare Lead New High List
- Materials SPDR and Top Component Look Weak
- XLE Forms Bull Pattern as XES Hits Moment-of-truth
- Stocks to Watch (Big Banks and Big Healthcare)
- Click here to Watch
- Arthur Hill, CMT
Senior Technical Analyst, StockCharts.com
Book: Define the Trend and Trade the Trend
Twitter: Follow @ArthurHill


