With all the discussion of trade wars, recently the Chinese Yuan and the Japanese Yen have been falling. If a product is made in another country and the currency of that country drops, that makes the product less expensive to import for other countries. This is one method of dealing with trade imbalance. The total value of imported goods will drop bringing the trade imbalance closer in line. It could also mean more products get imported because other products are cheaper which doesn't solve the trade imbalance. A lower currency may create more imports rather than domestically built goods. It's tricky to see how it all plays out. The Yen might be tracking lower to compete with a lower Yuan etc. but that is outside the scope of this article. The main point is that changes in the currencies can affect trade imbalances and commodity prices as you'll see below.
This article is about Gold. Gold has tracked the Yen for years as the chart below shows. However, recently the Chinese Yuan also changed direction. On the chart below, all three (Gold, the Yen and the Yuan) topped out around April 1 2018.
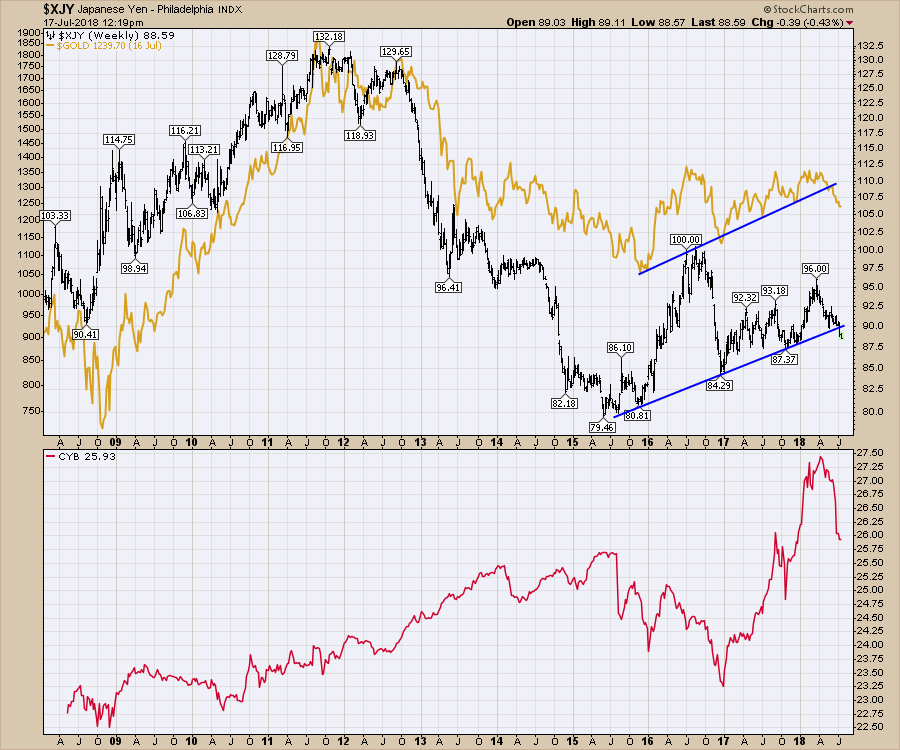
While I had some belief that the Yen and Gold would both hold their trend lines, the move below last week confirms they are clearly breaking down. When that happened in 2011, it was a good time to get out of the way for investing in Gold. They both tracked each other lower for multiple years. Four years actually. When the chart changes, it is a good idea to change with it.
The Yuan has not been as correlated to the others. But right now all three are very correlated and plunging. Now that the trend lines in the Yen and Gold did not hold, Gold investors should wait for a proper base to set up.
Below is the Commodities Countdown video that walks through the decimation going on in a lot of the commodities right now.
The Final Bar recording for Thursday July 12th contains information on the potential for rollover or breakout in the $USD. I cover off bonds as well. All of these markets are at very critical technical locations. If the USD is going to soar and create a bunch of trend changes on the other charts, you'll want to see the setups in advance. That is what the video covers off.
If you are missing intermarket signals in the market, follow me on Twitter and check out my Vimeo Channel often. Bookmark it for easy access!
Good trading,
Greg Schnell, CMT, MFTA
Senior Technical Analyst, StockCharts.com
Author, Stock Charts for Dummies
Want to read more from Greg? Be sure to follow his two StockCharts blogs:
Commodities Countdown and The Canadian Technician


