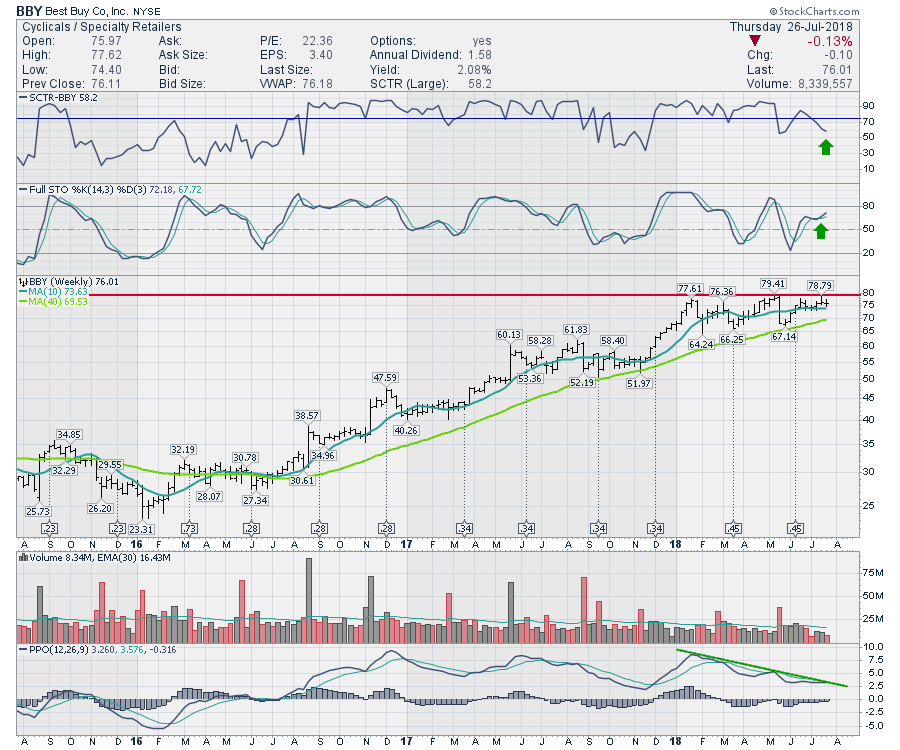
Best Buy (BBY) was all but thrown out in the retail washout a few years ago. 2017 was a huge year for the stock. In 2018, the stock has consolidated all year. Now Best Buy sits just below a buy point on a breakout trade plan.
The SCTR is holding in above 50 but is still pointed down at this point. After consolidating for so many months, it has lost a little price momentum. The Full Stochastic indicator suggests the trend is turning up again. Currently the stock trades sideways in a 7-week sideways consolidation, holding just above the 10 week moving average. The PPO shows a gentle pullback. If this could break the downtrend in momentum and start to turn higher, this will coincide with a breakout to new highs in the stock. That is a bullish combination; momentum turning up while above zero on the PPO, just as the price breaks out to fresh highs.
The Final Bar recording for Thursday July 26th contains information on the FANG stocks after Facebook broke a record for the largest market cap collapse. The video shows how to get set up for the retail seasonality of back-to-school, Thanksgiving and the holiday season.
Below is the Commodities Countdown video that walks through the concerns in the index set up right now.
The Canadian Technician video discusses a lot of the sectors and specifically reviews the technology sector stocks.
If you are missing intermarket signals in the market, follow me on Twitter and check out my Vimeo Channel often. Bookmark it for easy access!
Good trading,
Greg Schnell, CMT, MFTA
Senior Technical Analyst, StockCharts.com
Author, Stock Charts for Dummies
Want to read more from Greg? Be sure to follow his two StockCharts blogs:
Commodities Countdown and The Canadian Technician


