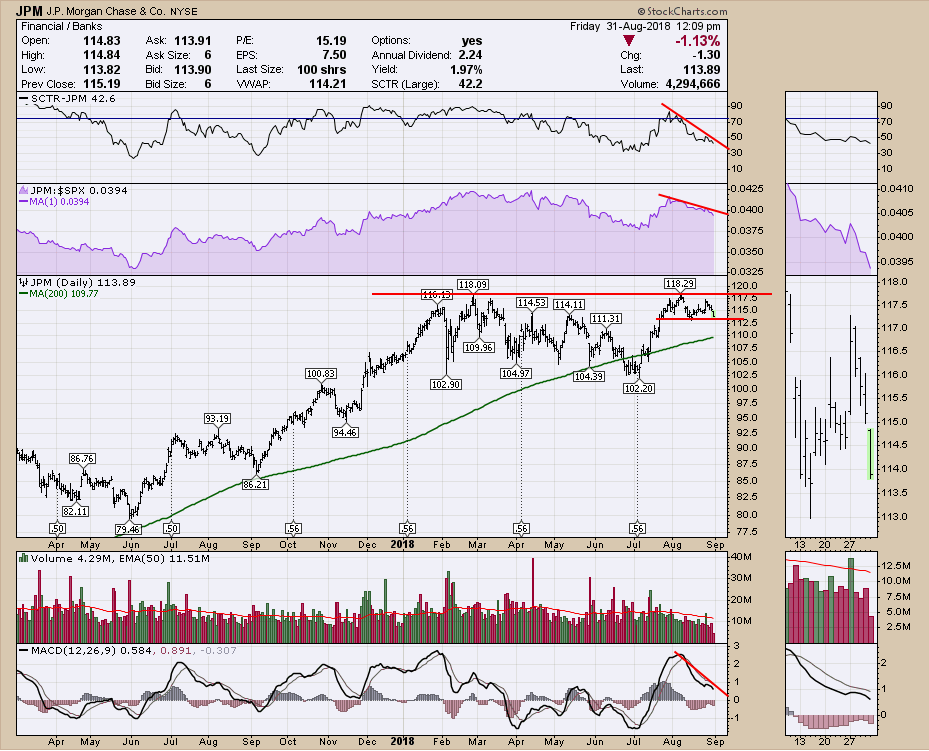
The big banks have been wandering sideways lately. JP Morgan (JPM) spent the month trying to push to new highs. Today's price action looks a little tepid to close out the month.
To review the indicators, there is a downtrend in relative strength in the shaded area. Price is stuck below the highs of the first quarter. While the volume looks weak, the bigger concern is the amount of red bars vs. green bars in the last three weeks. With only 1/3 of the bars closing positive on the day it warrants a closer look. In the zoom panel you can see the price has been jerked up on three big bars but the rest of the bars are small ranges on down days. Not bullish.
The SCTR shows JPM below 50 now and the MACD has lots of divergence with the price. In general the chart looks significantly weak compared to the big two week surge in the broader indexes.
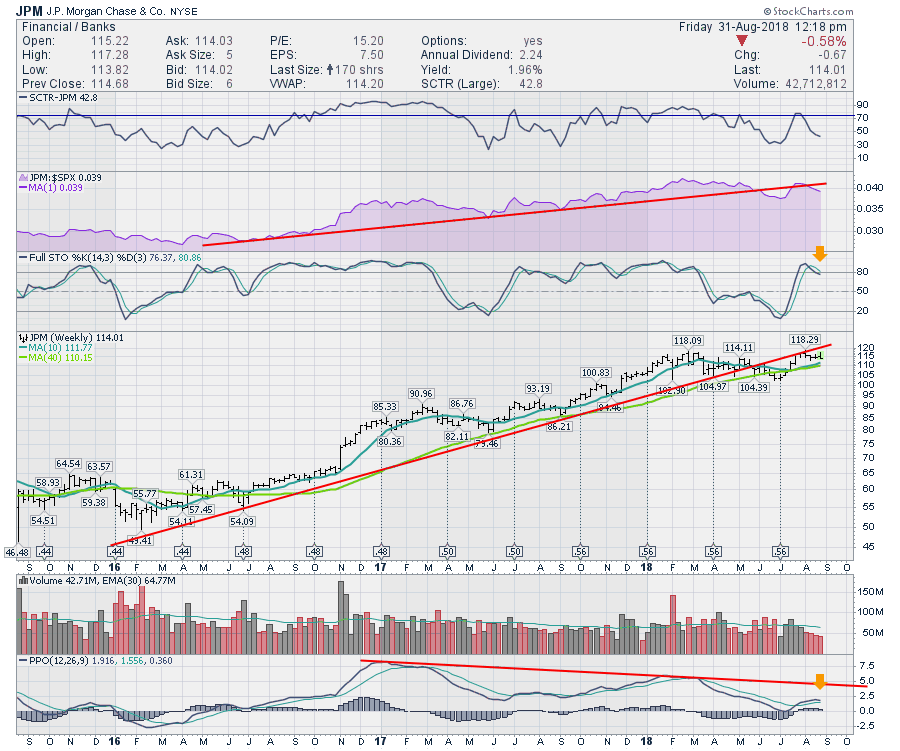
 Here is the JPM Weekly. On the recent Full Stochastic low, I mentioned it was a nice buying opportunity. Well a nice 10% surge looks great. The trade looks over to me. The PPO showing momentum is rolling over. The bigger concern is the stock recently broke the uptrend line and is very close to both the 40 week and 10 week moving averages. If the king of the banks is rolling over near its moving averages I would be more concerned about wider implications.
Attached are some recent videos I have posted. The Final Bar mentioned some short term overbought signals and some alerting of concern on the transports. The various transport subindexes looked like they are at the top of the range.
The Canadian Technician. While I was becoming more bullish when I recorded this on Monday, the Canadian market has since given back its breakout and is trading at fresh two week lows again...I would have to interject a note of caution on the pinocchio nose created. A false breakout is usually followed by a larger move in the other direction. The real problem is the Canadian market is back to prices we saw in June while the US markets are significantly higher.
The Commodities Countdown video covers off the setups in the precious metals charts this week.
I appeared on MarketWatchers Live August 24th, 2018 hosting a segment called Everything StockCharts. You can see the entire show here.
If you are missing intermarket signals in the market, follow me on Twitter and check out my Vimeo Channel often. Bookmark it for easy access!
Good trading,
Greg Schnell, CMT, MFTA
Senior Technical Analyst, StockCharts.com
Author, Stock Charts for Dummies
Want to read more from Greg? Be sure to follow his two StockCharts blogs:
Commodities Countdown and The Canadian Technician


