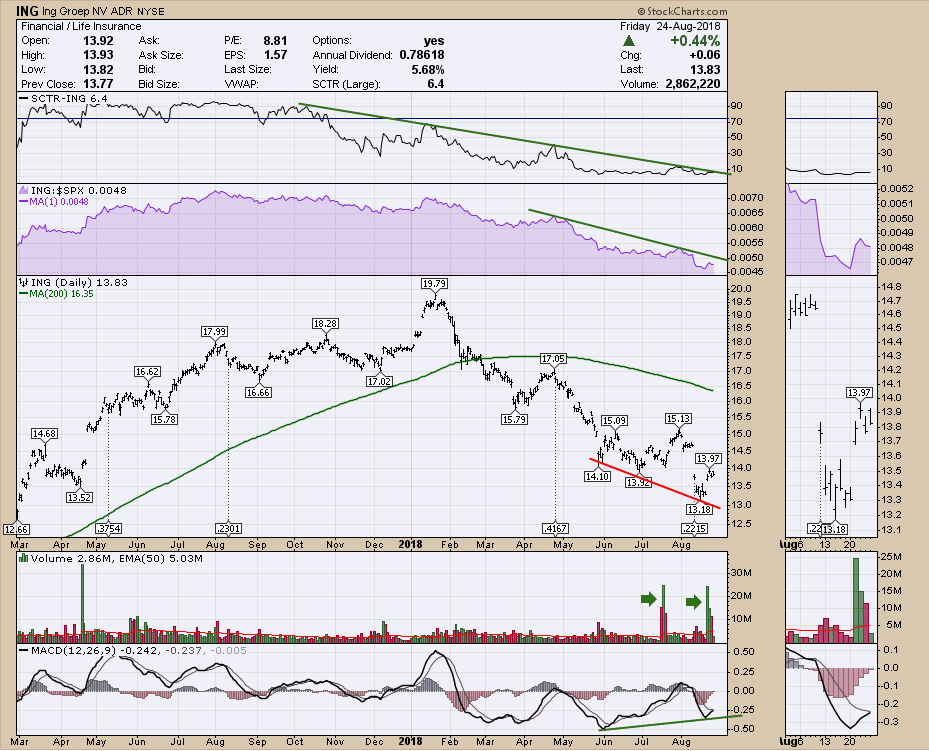
ING Bank has seen some large volume surges in the last two months suggesting the potential for some capitulation low. On the MACD we can see a positive divergence in momentum. The relative strength is obviously very weak as is the SCTR ranking. 
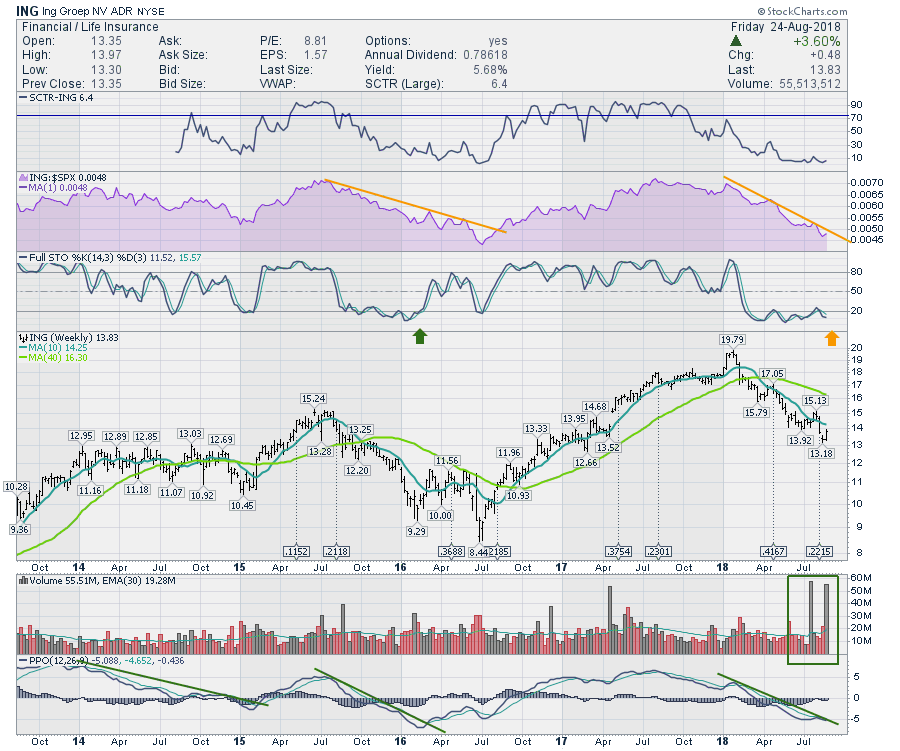
The weekly chart also has some nice information. We can see the two volume pillars are the largest in 5 years! Recently the full stochastic tried to move above 20 and pulled back but so far has a higher low. This positive divergence is worth keeping an eye on especially in light of the volume spike. The PPO and the Relative Strength both have meaningful trend lines that if breached would probably suggest an important change in trend for the stock.
 The nice part about this trade is a tight stop just under last weeks low and give the stock room to move as it tries to push higher.
On this week's Commodity Countdown video I cover off Oil, Natural Gas, Steel, Coal, bonds, currencies and breadth. Agriculture had a rough week. Thanks for watching.
The Final Bar.
I appeared on MarketWatchers Live August 24th, 2018 hosting a segment called Everything StockCharts. You can see the entire show here.
You can also click here to see Market Watchers Live Monday August 20, 2018.
If you are missing intermarket signals in the market, follow me on Twitter and check out my Vimeo Channel often. Bookmark it for easy access!
Good trading,
Greg Schnell, CMT, MFTA
Senior Technical Analyst, StockCharts.com
Author, Stock Charts for Dummies
Want to read more from Greg? Be sure to follow his two StockCharts blogs:
Commodities Countdown and The Canadian Technician


