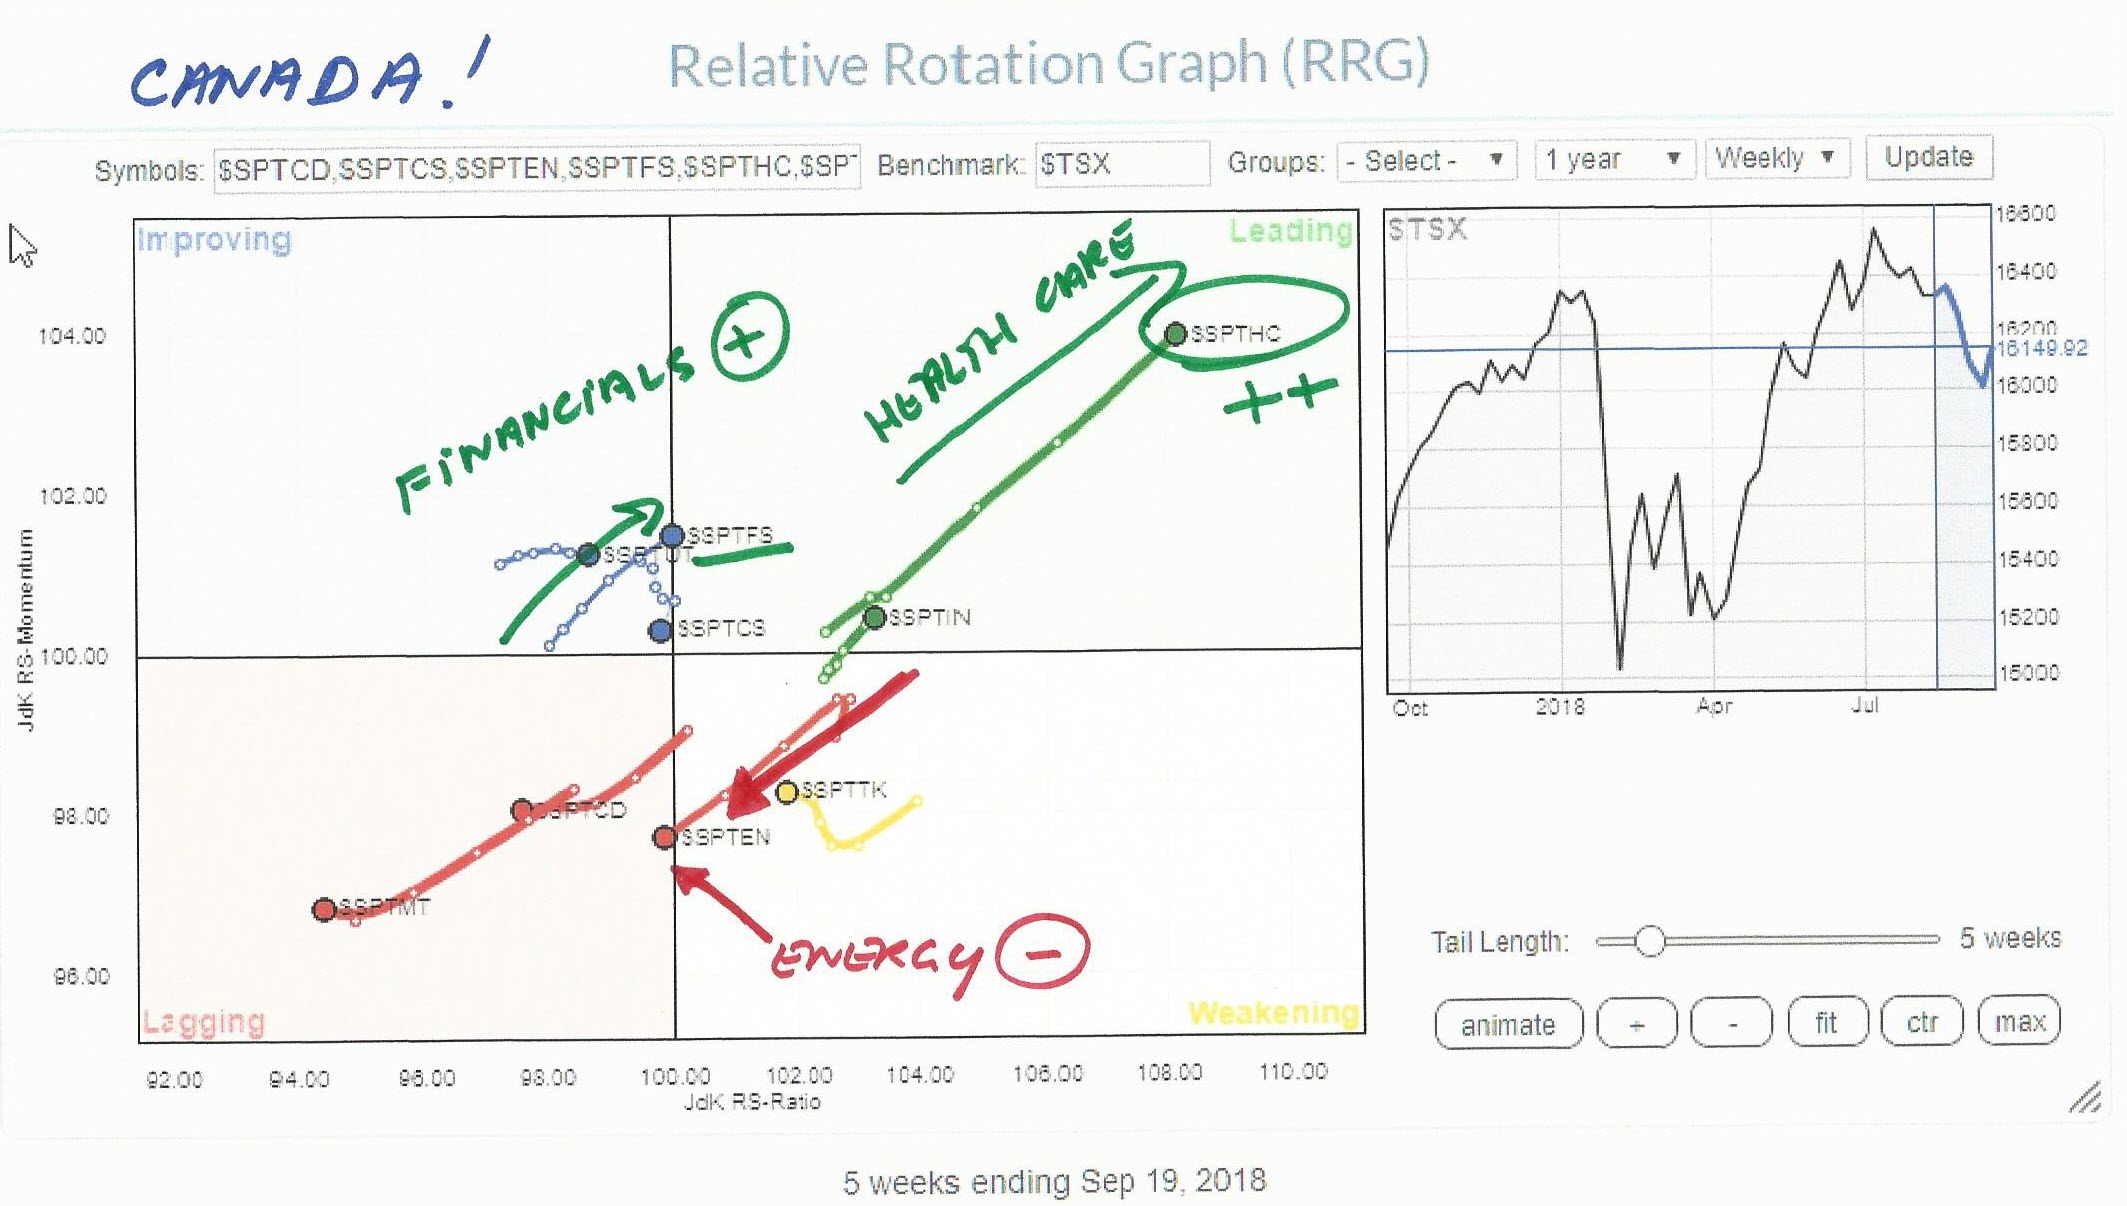
 While browsing through some pre-populated RRGs on the site I stumbled upon the chart holding Canadian sectors.
What immediately triggered me was the sharp move of the Healthcare sector into the leading quadrant at almost 45 degrees which means that the sector is moving higher on both axes which is a strong sign.
In a closed universe like this, if something moves up something else must go down to offset the move. And in this case, that seems to be the Energy sector which just crossed over into the lagging quadrant in pretty much the exact opposite direction as Healthcare.
$SPTEN is also moving in an almost straight line at an RRG-heading 0f 225 degrees, which means going lower on both scales.
While scanning the other sectors in this universe, another one that looks interesting enough for further inspection is the Financials Services sector ($SPTFS).
This sector just crossed over into the leading quadrant from improving which raises the question about which sector could have the most potential? Health Care is already deep into the leading quadrant and therefore is in a more established trend while Financial Services has only just crossed over and therefore probably just at the beginning of a new, potential, relative uptrend.
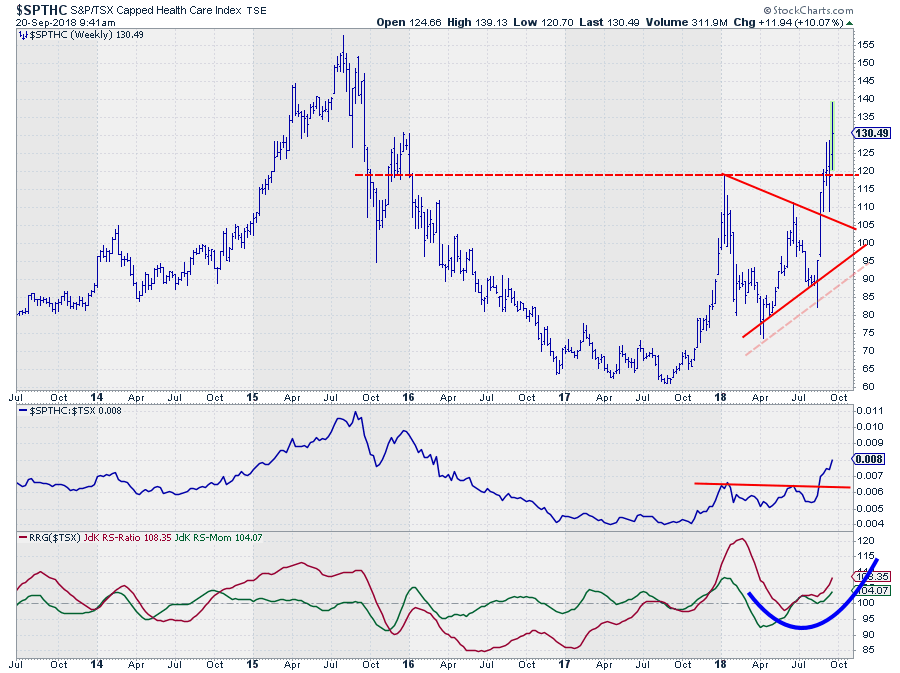
After studying the charts of both the Healthcare and the Financial Services sector my preference goes to Healthcare as this sector has already broken some overhead resistance levels where Financial Services has a few more hurdles to overcome before upward potential really gets unlocked.
Let me know what you think of this usage of RRG in the comments below. If you would like to receive a notification when a new RRG blog article is published, simply "Subscribe" with your email address.
Julius de Kempenaer | RRG Research
RRG, Relative Rotation Graphs, JdK RS-Ratio, and JdK RS-Momentum are registered TradeMarks ®; of RRG Research
Follow RRG Research on social media:
If you want to discuss RRG with me on SCAN, please use my handle Julius_RRG so that I will get a notification.


