 The S&P 500 fell to its lowest level since early July and pierced its 200-day moving average last week. Chartists looking for stocks that held up better during this decline can use these levels for comparison. Stocks that did not break below their August lows and 200-day moving averages held up better and show relative "chart" strength.
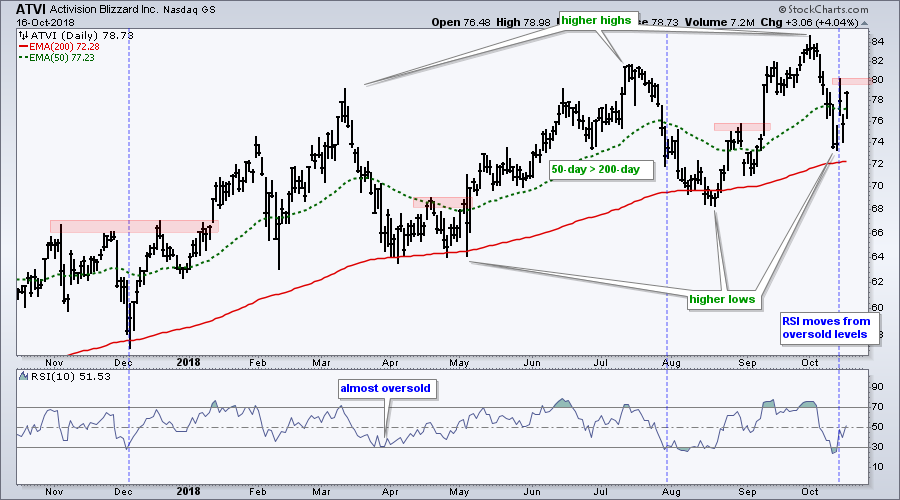
The chart below shows Activision Blizzard (ATVI) with a series of higher highs and higher lows over the past year. The stock fell with the rest of the market in early October, but did not even test its August low and did not break the 200-day EMA. Thus, ATVI held up better than the S&P 500.
Despite a questionable environment for the broader market, ATVI remains in a clear uptrend. The stock hit a new high in early October and the 50-day EMA remains comfortably above the 200-day EMA. The indicator window shows RSI(10) becoming oversold last week and moving above 30 on Friday. This suggests an oversold bounce in the making and a possible challenge to the October high.
On Trend on Youtube
Available to everyone, On Trend with Arthur Hill airs Tuesdays at 10:30AM ET on StockCharts TV and repeats throughout the week at the same time. Each show is then archived on our Youtube channel.
Topics for Tuesday, October 16th:
- Volatility Increases when Below 200-day (Risk On/Off)
- Don't Estimate Depth or Duration (Dow Theory)
- Scanning for Above/Below 200-day (Weight of Evidence)
- The Game Changer for Tech (SOXX, XSD)
- Commodity Review (Gold, Oil, Palladium)
- Click here to Watch
Plan Your Trade and Trade Your Plan.
- Arthur Hill, CMT
Senior Technical Analyst, StockCharts.com
Book: Define the Trend and Trade the Trend
Twitter: Follow @ArthurHill


