Revlon (REV) showed up on the 52 week high scan today. On the chart there were some intra-week moves to higher levels but based on close only daily data, Revlon is pushing up. What is really important is the relative strength of Revlon. While the overall market was dropping quickly, Revlon stock was being bought up. The Relative Strength area chart in purple shows new 52 week highs as well as on the price panel. The SCTR is moving up after being at the bottom of the range. This sort of thrust is usually a helpful indicator of new interest.
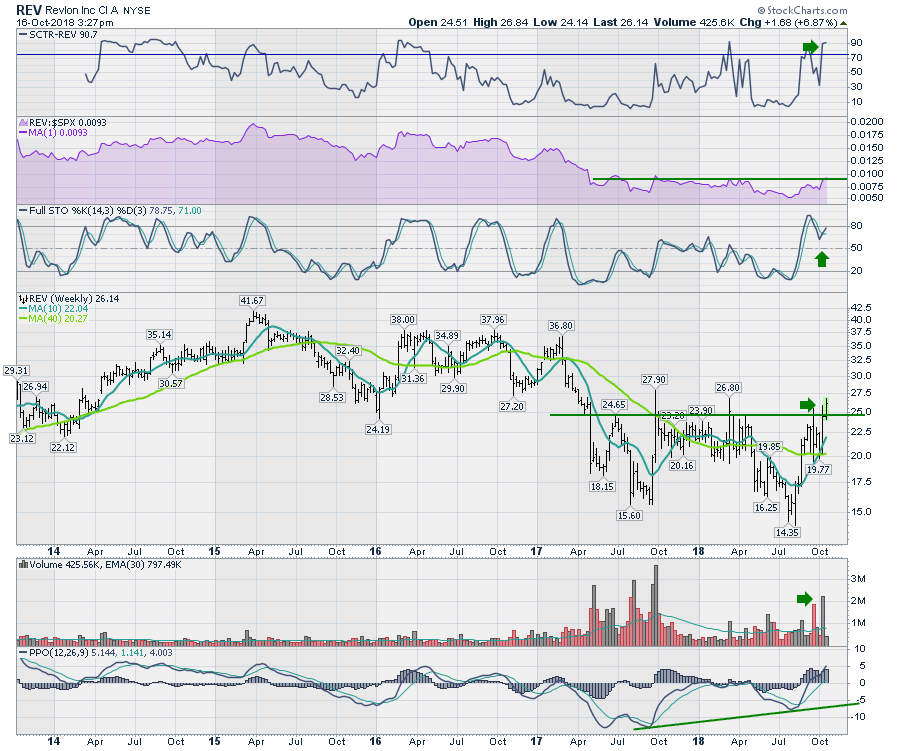 With the volume picking up and the PPO moving back above zero for the first time in a couple of years, this sets up very nicely.
The Canadian Technician video shows the massive breakdown on almost every sector chart. This week the Canadian market started what appears to be a major breakdown. Financials also fell outside their channel and below the 40 WMA. For Canadian investors, huge caution here.
Gold is perking up, a few of the agriculture commodities are perking up and Natural Gas has been behaving well. However, the stocks around those areas are still struggling with the overall market sentiment. Lots of information in here on the indexes, currencies, bonds and commodities.
This is a quick look at the market setup and an introduction on why Gold is starting to look good. It has nothing to do with the broad market weakness. It is the charts of gold and gold miners doing the talking.
If you are missing intermarket signals in the market, follow me on Twitter and check out my Vimeo Channel often. Bookmark it for easy access!
Good trading,
Greg Schnell, CMT, MFTA
Senior Technical Analyst, StockCharts.com
Author, Stock Charts for Dummies
Want to read more from Greg? Be sure to follow his StockCharts blog:
The Canadian Technician


