 United Parcel Service (UPS) is a global player in logistics and package delivery. The outlook for the global economy is surely dimming with the Shanghai Composite ($SSEC) falling all year, the German DAX Index ($DAX) and French CAC Index ($CAC) hitting new lows, and the S&P 500 turning south over the last two months.
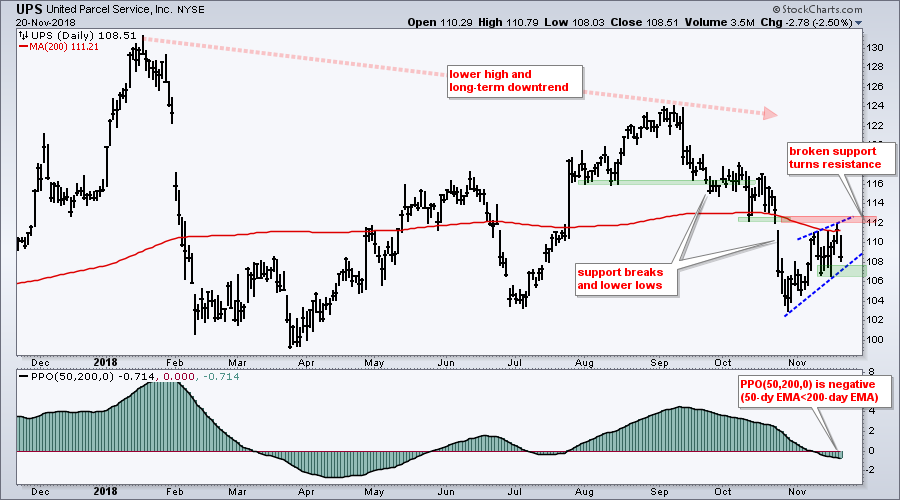
Even though the stock has yet to hit a 52-week low, the long-term trend is down. The chart below shows UPS with a lower high from January to early September. The stock peaked a few weeks before the S&P 500 and broke its summer lows in late October. UPS broke the 200-day SMA in the process and the 50-day EMA moved below the 200-day EMA last week (PPO(50,200,0) turned negative).
Short-term, the stock bounced back to the last support break and the falling 200-day SMA in mid November. Broken support turns resistance and this could mark a turning point. Notice that a rising wedge formed with support set in the 106-108 area. A break below this zone would signal a continuation lower and target a test of the March low.
On Trend on Youtube
Available to everyone, On Trend with Arthur Hill airs Tuesdays at 10:30AM ET on StockCharts TV and repeats throughout the week at the same time. Each show is then archived on our Youtube channel.
Topics for Tuesday, November 20:
- Low Volatility versus High Risk.
- Failure to Follow thru on Piercing Patterns.
- Fab Five Leading Lower.
- Bonds Perk Up and Outperform.
- Checking Seasonality and Sentiment.
- Click here to Watch
Plan Your Trade and Trade Your Plan.
- Arthur Hill, CMT
Senior Technical Analyst, StockCharts.com
Book: Define the Trend and Trade the Trend
Twitter: Follow @ArthurHill


