 The US elections are on Tuesday and the financial press is full of tips based on possible outcomes. Basing a financial decision on a news event means we must get two things right. First, we must successfully predict the news (election results). Second, we must then successfully predict the market's reaction to the news. Double parlays are hard to hit.
More often than not, the market reacts and the press then picks the news twist that best fits the reaction. Bonds plunged on Friday and weakness was attributed to better-than-expected growth in non-farm payrolls, never mind the long-term downtrend. The news twist would surely have been different if bond prices rose sharply on Friday.
Thus, when it comes to investing and trading, we are often better off focusing on the chart - the whole chart and nothing but the chart. Sorry for the click-bait title.
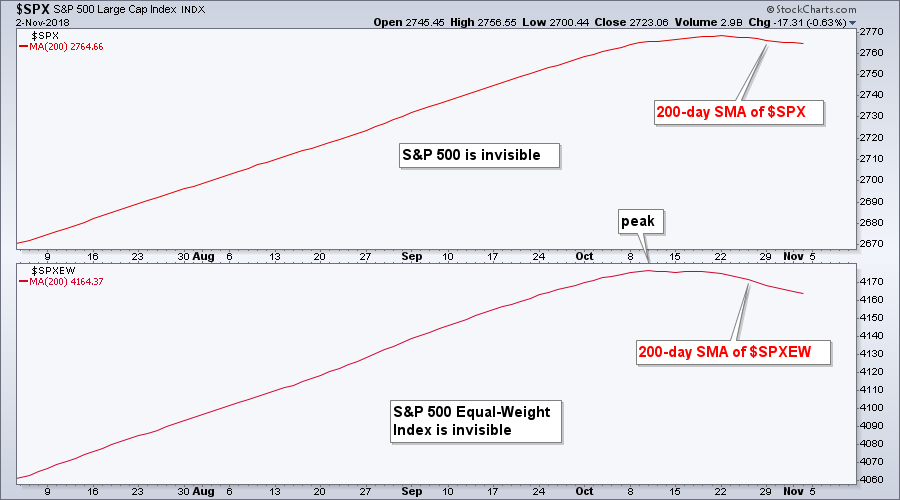
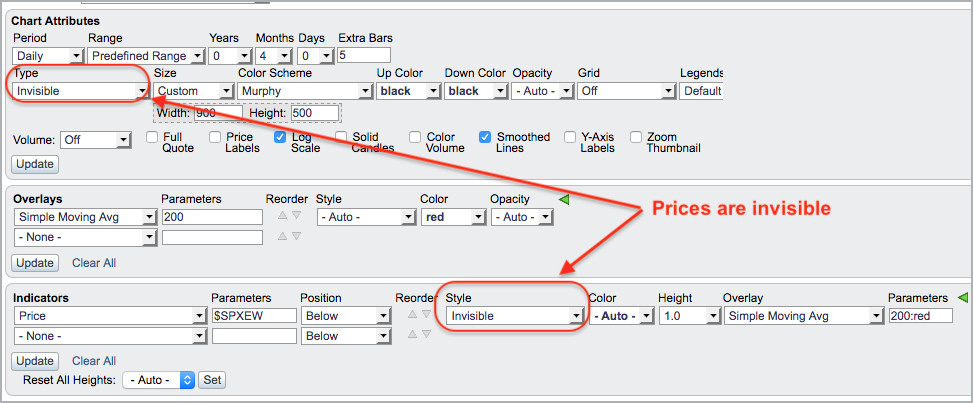
Speaking of charts, the chart below shows the 200-day SMAs for the S&P 500 and the S&P 500 Equal-Weight Index ($SPXEW). Their price plots were made invisible to highlight the movement of the 200-day SMAs. Notice that the moving average for the S&P 500 edged lower the last two weeks and the moving average for the S&P 500 Equal-Weight Index peaked on October 10th. These long-term moving averages are turning down and this is not a good sign for the long-term trend.
Plan Your Trade and Trade Your Plan.
- Arthur Hill, CMT
Senior Technical Analyst, StockCharts.com
Book: Define the Trend and Trade the Trend
Twitter: Follow @ArthurHill


