Mosaic shot to a fresh new high today, continuing the uptrend. While the broader market has been trying to bounce, we can see this stock has been on the move for a while. This beautiful uptrend was hardly interrupted by the recent broad market slide. Today the stock rocketed 10% to resume the push to new highs.
The SCTR has been trending higher over the last year. While the stock was rising, the SCTR was just middle of the pack, but over the last few months the stock has really started to be a top performer by being pinned near the top. The relative strength has been climbing. This is an important characteristic of a winning stock. It is outperforming the $SPX over and over repeatedly. This continued outperformance keeps attracting institutional investors.
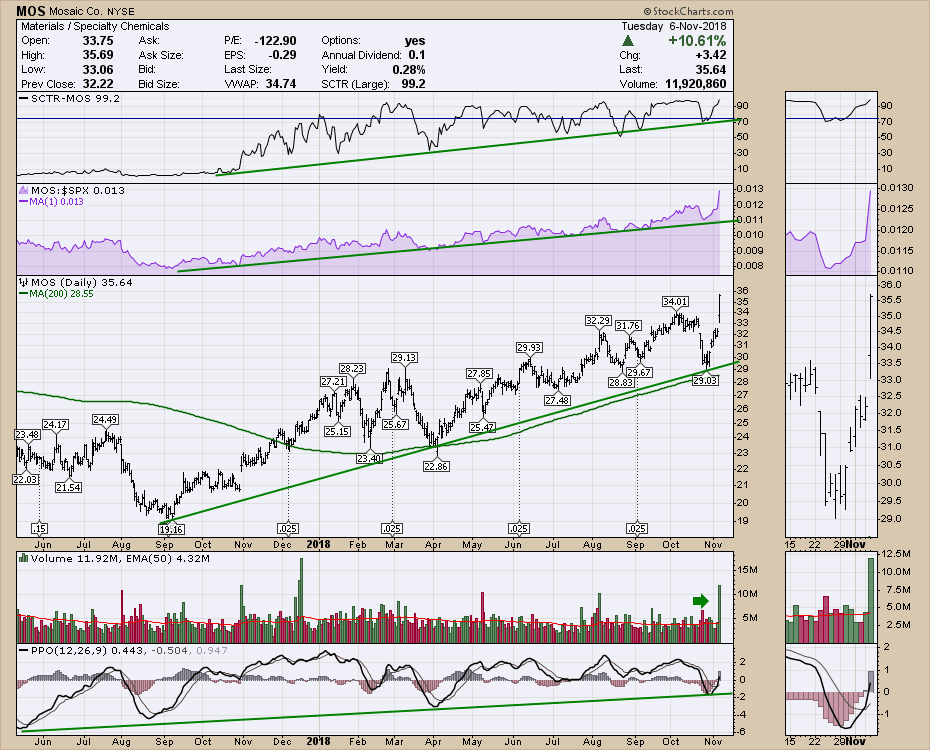 With the high volume on the breakout today, it continues to attract institutional size investment. Todays volume was easily double the regular volume.
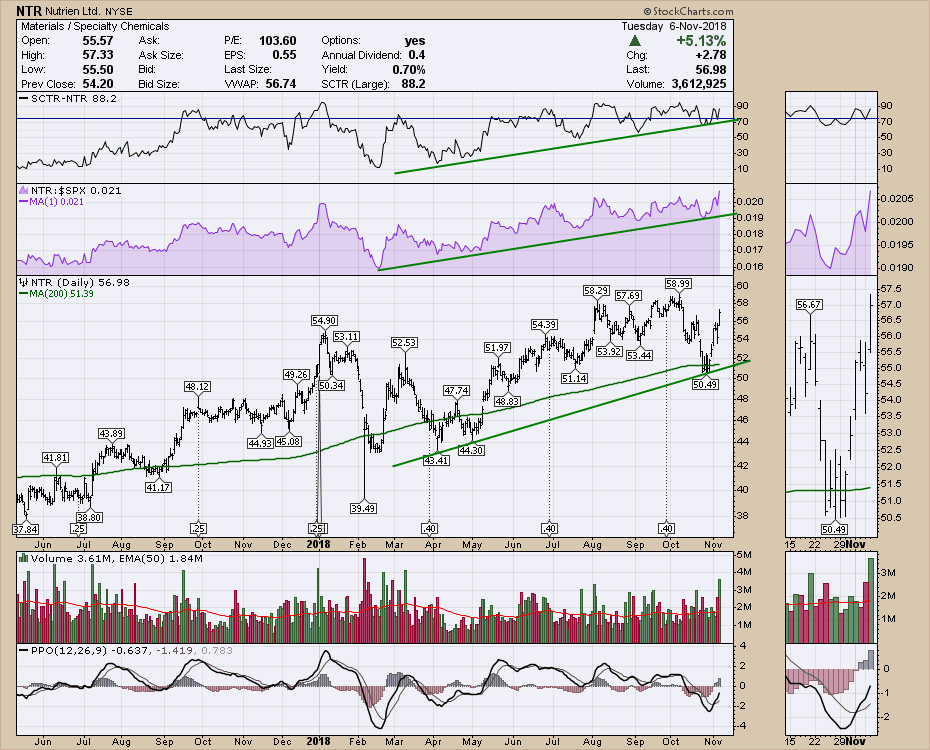
While this setup on MOS is nice. Looking across the industry at the major players, both Nutrien and CF Industries are setting up to break out as well.
 The chart of CF looks really strong as well. Notice the similarities between all the charts.
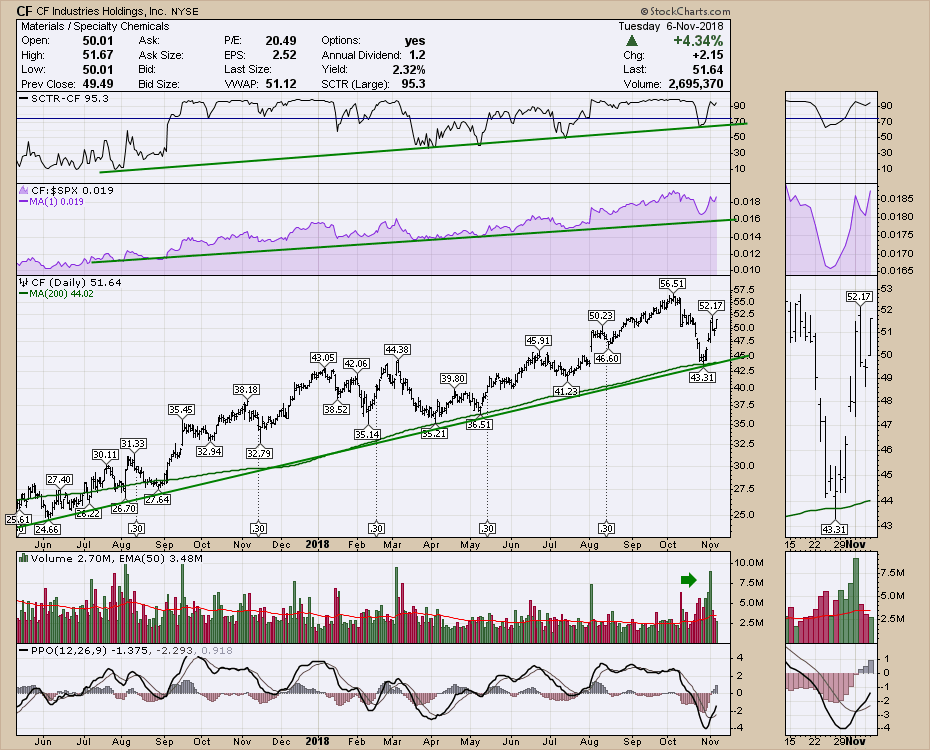
I like the setup across the industry. It is also nice that the group seems to be setting up for continued outperformance after some mergers. I still have trouble with the overall market setup trying to rebound. The strength of this group suggests it might be able to outperform more broad weakness.
The Canadian Technician video shows the massive breakdown on almost every sector chart in Canada. Canada is back below the 2008 highs. Tough ten years for investors.
Here is this week's video.
This video covers off some of the recent price action around the lows.
If you are looking for a small gift, you might have family or friends that would like to learn more about the basics of charting. The first section of the book walks through all the chart settings to get the charts you want. The second section is why you might use charts for investing and the third section is putting it all together.
Click here to buy your copy today! Stock Charts For Dummies.
If you are missing intermarket signals in the market, follow me on Twitter and check out my Vimeo Channel often. Bookmark it for easy access!
Good trading,
Greg Schnell, CMT, MFTA
Senior Technical Analyst, StockCharts.com
Author, Stock Charts for Dummies
Hey, have you followed me on Twitter? Click the bird in the box below!
Want to read more from Greg? Be sure to follow his StockCharts blog:
The Canadian Technician


