 There are many indexes available to monitor and analyze the stock market. The S&P500, together with Daddy "Dow" being among the more popular ones.
But the S&P 500, although covering 500 stocks, is only looking at one segment of the total market. Only large-cap stocks. A broader perspective can be gained from looking at the S&P 1500 composite index for example. Still not covering the entire US stock market, which nowadays counts around 4000, more or less actively traded, listed companies, but a pretty good gauge.
Very often we break down the market into its sectors and try to get a handle on sector-rotation or a view on the general market by analyzing which sectors are doing better or worse than the S&P 500 and splitting them into offensive and defensive.
Another way of breaking up a market is by looking at segments based on market capitalization. The S&P 500 index covers "only" one-third of the composite index. The S&P 400 Mid-cap index ($MID) and the S&P 600 Small-cap index ($SML) make up for the other two thirds.
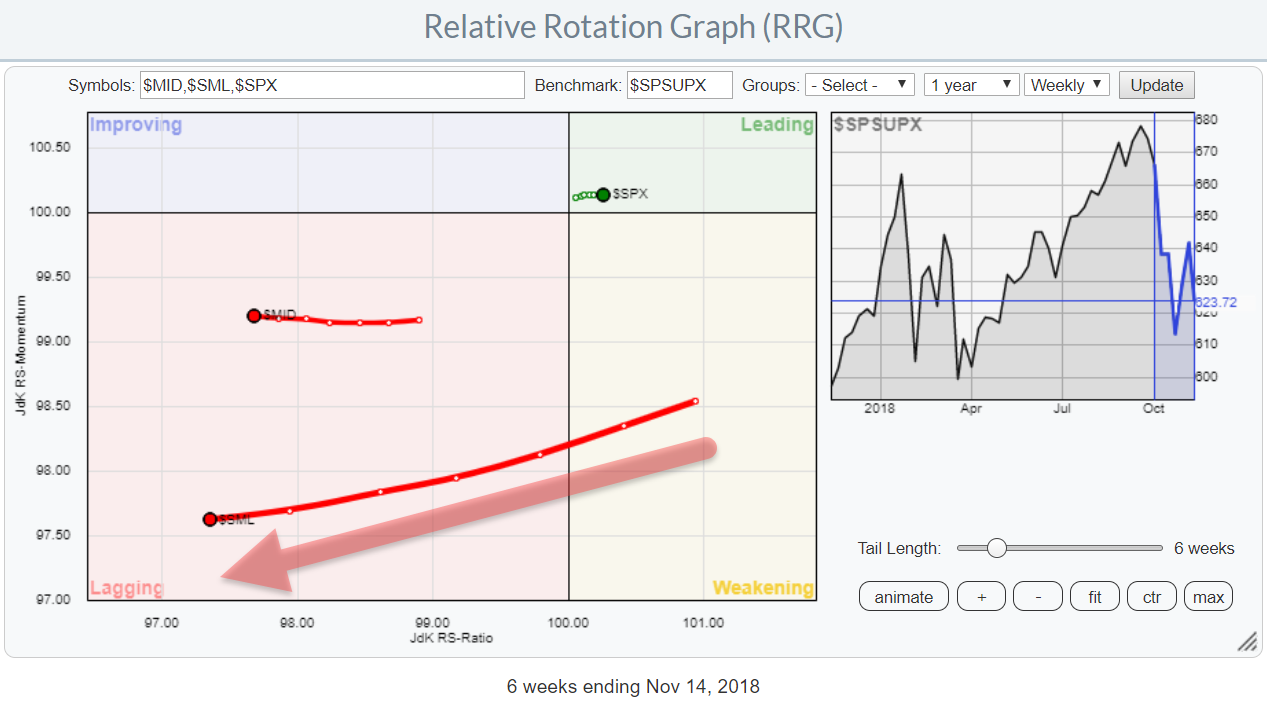
The Relative Rotation Graph above shows these "size-indexes" in relation to the S&P 1500 composite which is used as the benchmark (center) of the graph. Just like you can use an RRG to monitor the relative rotation of various sectors they can be used to track the rotation of various groups based on market cap.
Intermarket theory teaches us that Small-caps are often leading the stock market up or down.
On the RRG above there is very little doubt about the position and the movement of small-cap stocks vis-a-vis the general market. A seriously long tail, compared to mid- and large-caps is pushing $SML deep into the lagging quadrant and sending a strong "risk-off" signal.
If you still need to be invested in stocks, the focus should be on large-cap stocks.
My regular blog is the RRG blog If you would like to receive a notification when a new article is published there, simply "Subscribe" with your email address using the form below.
Julius de Kempenaer | RRG Research
RRG, Relative Rotation Graphs, JdK RS-Ratio, and JdK RS-Momentum are registered TradeMarks ®; of RRG Research
Follow RRG Research on social media:
Feedback, comments or questions are welcome at Juliusdk@stockcharts.com. I cannot promise to respond to each and every message but I will certainly read them and where reasonably possible use the feedback and comments or answer questions.
If you want to discuss RRG with me on SCAN, please use my handle Julius_RRG so that I will get a notification.


