Canopy Growth Corporation (CGC) sits at support to close out the weekend. Is it about to collapse or surge? If you are interested in the most recent parabolic trading industry, marijuana legalization, it matters, as Canopy is widely seen as a leader in the group. For most investors, the sudden surge in August caught them off guard. Now would be the time to monitor CGC for a possible entry with a close stop. There is nothing on the chart that is a buy signal as of Friday, but there are lots of technical reasons to consider trading this stock in the near future.
Let's analyze the big picture first. In terms of relative strength (RS), if CGC wants to keep attracting investors, it will need to outperform the $SPX in the big picture. I have placed the blue trend line on the area chart just slightly away from the lows. Something I noticed was that the stock has consistently made higher lows in RS on the weekly chart. While it has cyclical swings, each low is higher than the previous cyclical low. I would continue to watch this RS uptrend. If the RS trend line is broken, that would reduce my interest significantly. Note that if that trend line breaks, the July RS must then hold as the last point of support.
This stock has only given us one full stochastic low below 20. Now, however, the stock has pulled the full stochastic down. Watch closely over the next month for this to cross its signal line and set up a trade.
Price is very interesting this week. This is the lowest close in the last three weeks, where the price traded in a tight range. It is also the first close below the 40-week moving average since August 2017. Back then, the price stayed close to the 40 week and then accelerated from there. The Friday close was also the level the price broke out from ($30) in August 2018. The high of this week's bar at the $35 level was also resistance for the first 1/2 of 2018. The fact that price has stalled under the $35 level is concerning. The outside price bar this week tested the highs of the last few weeks and closed at the lows from those same two weeks. If anyone wanted to sell, this dip below the previous lows would probably have kicked them out. If the stock is going to be resilient and find a base to build on, it's right here.
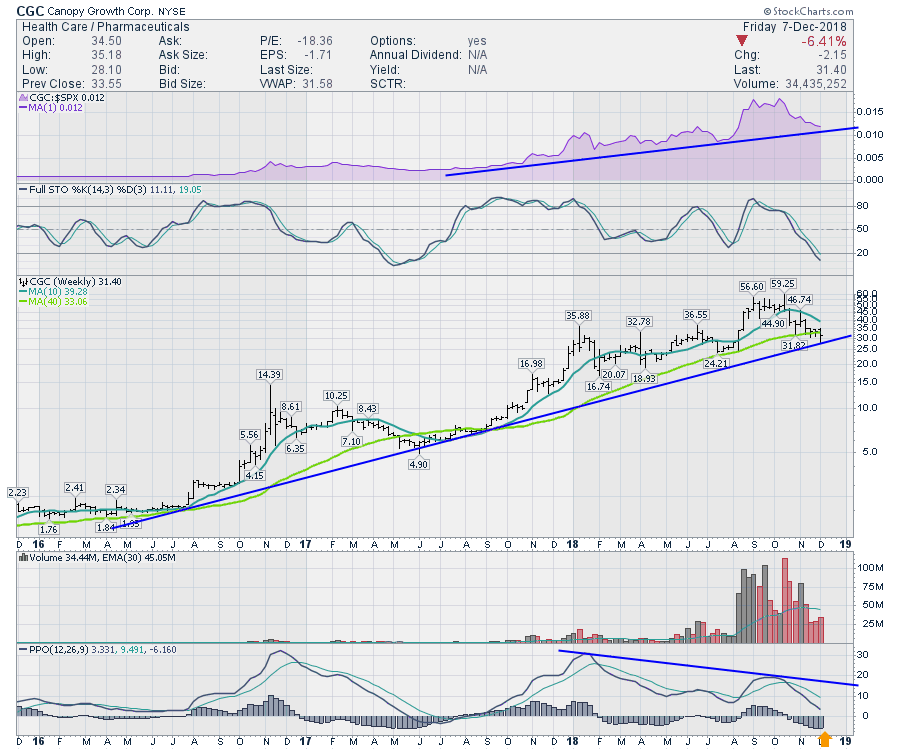 Looking at the PPO, if it could find support around the zero level and reset, that would make for a nice trading low. The second component of analyzing a trade down here is the ability to place a tight stop if we are wrong.
As the next few weeks roll by, watch to see if price continues to stabilize here or if Canopy collapses. If it doesn't stabilize, you can probably wait a while longer. These four main data points are important for the long-term health of the stock and they are all at informative levels.
- The relative strength uptrend
- The price resting on the long-term uptrend
- The PPO reseting above or near zero
- A full stochastic that hasn't been this weak in 18 months.
Below is a video produced this week by our video producer Gretchen Pitluk and narrated by Erin Swenlin. I found it very informative, so I thought I would share it here.
If you are looking for a small gift, you might have family or friends that would like to learn more about the basics of charting; if so, they'll love Stock Charts for Dummies. The first section of the book walks through all the chart settings to get the charts you want, the second section explores why you might use charts for investing and the third section is about putting it all together.
Click here to buy your copy of Stock Charts For Dummies today!
This Final Bar video shows three simple scans users can work through to help find strong stocks off of the lows.
If you are missing intermarket signals in the market, follow me on Twitter and check out my Vimeo Channel. Bookmark it for easy access!
Good trading,
Greg Schnell, CMT, MFTA
Senior Technical Analyst, StockCharts.com
Author, Stock Charts for Dummies
Hey, have you followed me on Twitter? Click the bird in the box below!
Want to read more from Greg? Be sure to follow his StockCharts blog:
The Canadian Technician


