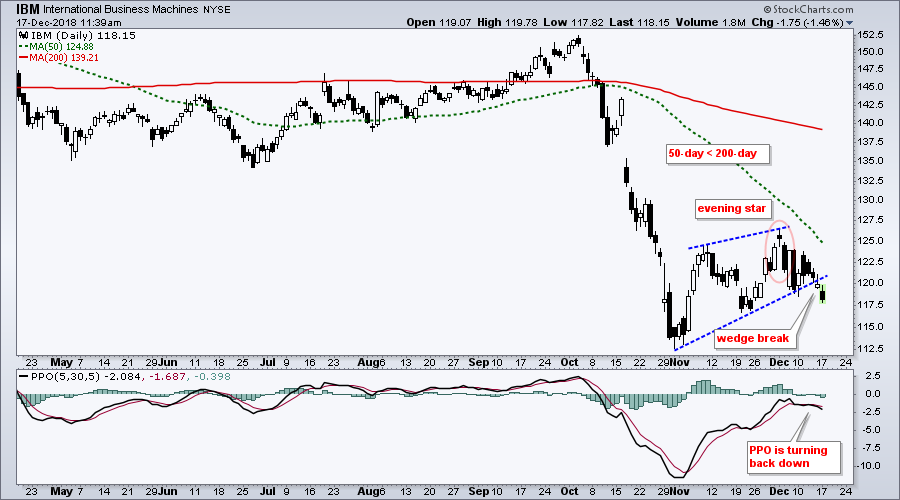
 IBM is one of the worst performing stocks in the S&P 500 this year with an 18% decline year-to-date - and it could get worse.
First and foremost, the long-term trend is down because the stock recorded a 52-week low in late October, the 50-day moving average is below the 200-day moving average and price is below the falling 200-day moving average.
IBM plunged in October with a 25% decline from October 3rd to October 31st. We do not need a momentum oscillator to know that the stock was severely oversold in late October. IBM then worked off this condition with a bounce into early December.
A rising wedge took shape as the stock reversed with an evening star pattern in early December (red oval). IBM continued lower last week and broke the wedge line the last two days. This break signals an end to the counter-trend bounce and a resumption of the bigger downtrend.
The indicator window shows the PPO (5,30,5) rebounding with a move above the -1% level early December. This momentum oscillator turned back down the last few days and this downturn confirms the wedge break.
On Trend on Youtube
Topics from Thursday, December 13th:
- Weak Breadth on Reversal Attempt.
- Support is Suspect in a Downtrend ($SPX, $SPXEW).
- Bear Market Expectations Apply (Divergences).
- EW Sectors Reflect Broad Weakness.
- Stocks to Watch (CHRW, IBM, INTC, EL, FLS...).
- Click here to Watch
- Arthur Hill, CMT
Senior Technical Analyst, StockCharts.com
Book: Define the Trend and Trade the Trend
Twitter: Follow @ArthurHill


