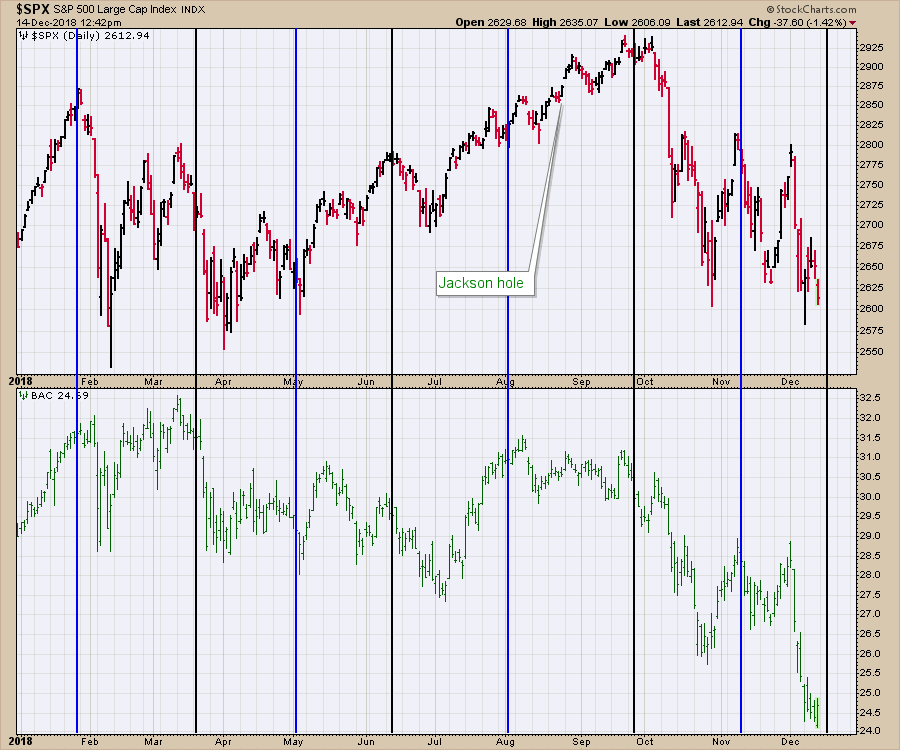
The banking sector has been drilling holes in the bottom of empty Christmas stockings this year. All the big name US stocks are making new lows, but the real concern is the sheer size of the drop. Citi (C) is down 16% in just 2 weeks! BAC is down 25% from the annual highs! Wells Fargo (WFC) is down 28% this year! With the $SPX just slightly negative on the year, you can see the real pain for investors. While these banks are bleeding, there might be some hope showing up next week in the form of the Fed meeting.
You'll notice BAC is plotted on the lower half of this chart. The Fed meeting dates are visualized on the chart as vertical lines. The increasing Fed rates have pushed this stock around as most of the Fed meetings have the stock rolling over shortly after. If the Fed indicates any level of dovishness towards interest rates, this may be a nice inflection point for the stock.
 The last few days have seen the stock trying to stabilize. The bullish outside bar on BAC is a positive while the overall market is down 1.42% on the chart above. I think we all know that weak bank charts are not bullish.
At this point, I'd be looking for the Fed to move in line with what the market is expecting, but any dovish comments could be a big accelerator. We also have quadruple witching on Friday December 21st, which is usually a high volume event. If the banks can start to rally, I think it will set the stage for a big bullish push.
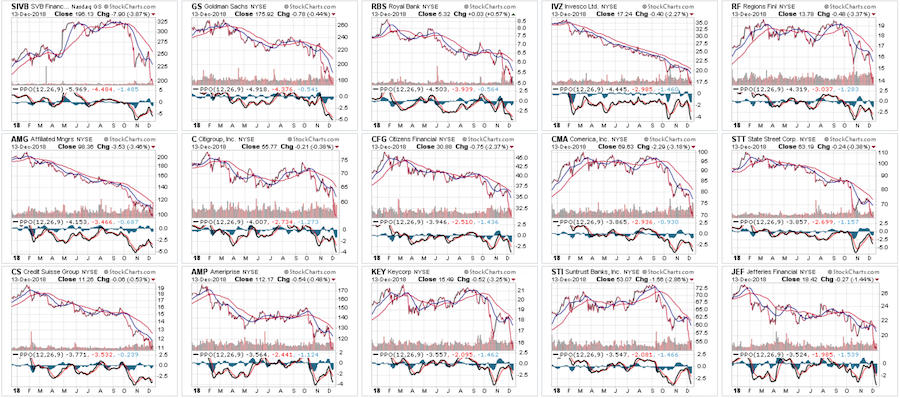
While some are looking at the yield curve as "the problem," it is definitely just one of the factors. The global picture for banks is horrific and has been for some time. To offset my expectation of a bounce above, look at this global banking chart display. These charts look terrible.
 I would suggest that a big bounce to reenergize investors is needed. How big that bounce is might depend more on global banking stabilizing than the US Fed. I think the Fed could be the catalyst, but these charts are seeing bigger issues. For that reason, this is a Don't Ignore This Chart article!
This Final Bar video shows some concerning charts. However, getting ready for the next rally is key.
I have been discussing the gold setup for weeks now, but the breakout seems to be just getting started. In the video, I work through gold and would encourage you to view this setup in detail. I will update this video on Saturday as gold has pulled back from the highs.
Below is a video created this week by our video producer Gretchen Pitluk and narrated by Erin Swenlin. I found it very informative, so I thought I would share it here.
For those of you who are looking for a small gift, you might have family or friends that would like to learn more about the basics of charting; if so, they'll love Stock Charts for Dummies. The first section of the book walks through all the chart settings to get the charts you want, the second section explores why you might use charts for investing and the third section is about putting it all together.
Click here to buy your copy of Stock Charts For Dummies today!
If you are missing intermarket signals in the market, follow me on Twitter and check out my Vimeo Channel. Bookmark it for easy access!
Good trading,
Greg Schnell, CMT, MFTA
Senior Technical Analyst, StockCharts.com
Author, Stock Charts for Dummies
Hey, have you followed me on Twitter? Click the bird in the box below!
Want to read more from Greg? Be sure to follow his StockCharts blog:
The Canadian Technician


