 Yesterday, on boxing day, the Dow jumped 1000 points from its 52-week low which, coincidentally, was also set yesterday. Never a dull moment. But, what does it mean?
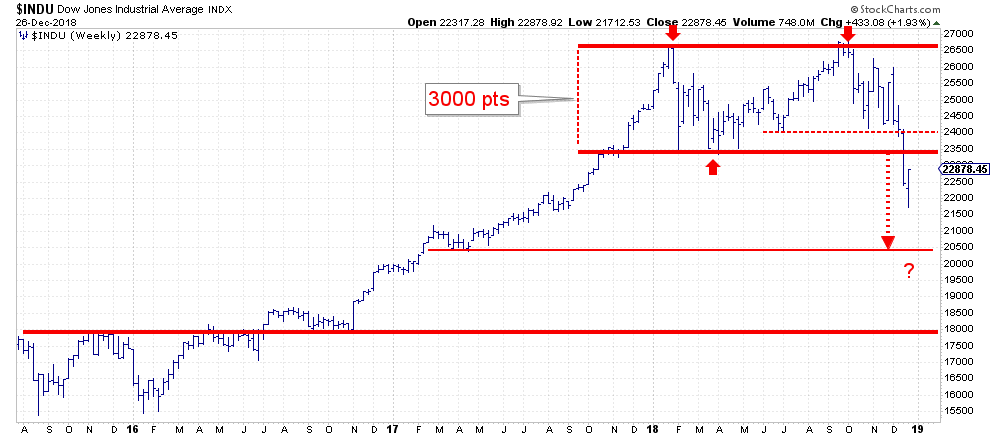
Looking at the weekly chart above, at least IMHO, it means only a (small) recovery of the damage that has been done since the start of October when $INDU almost touched 27.000. However, it is nowhere near enough to change the structure of the market back to bullish.
The break below support at 23.500 last week confirmed the end of the series of higher highs followed by higher lows. This happened after a first serious warning signal was sent at the start of October when the market could not penetrate its previous high that was set in January.
That break opened up the way to a price target around 20.500 that can be derived by measuring the height of the range and projecting it below the breakout level. Any rally at the moment is expected to find resistance around 23.500, or maybe the range between 23.500 - 24.000.
This structure suggests that we have moved from a market where you could "Buy the dips" to a market where you may want to "Sell the rallies".
I am not sure if a rally AFTER Christmas counts as a Santa rally but if it does we may want to "Sell the Santa rally"
So a 1000 point rally .... That don't impress me much.
In case you're wondering where the inspiration for the title came from.. That Don't Impress Me Much
My regular blog is the RRG blog If you would like to receive a notification when a new article is published there, simply "Subscribe" with your email address using the form below.
Julius de Kempenaer | RRG Research
RRG, Relative Rotation Graphs, JdK RS-Ratio, and JdK RS-Momentum are registered TradeMarks ®; of RRG Research
Follow RRG Research on social media:
Feedback, comments or questions are welcome at Juliusdk@stockcharts.com. I cannot promise to respond to each and every message but I will certainly read them and where reasonably possible use the feedback and comments or answer questions.
If you want to discuss RRG with me on SCAN, please use my handle Julius_RRG so that I will get a notification.


