 AD Percent for the S&P 500 dipped below -90% on Monday and this was the sixth reading below -90% this year. AD Percent equals advances less declines divided by total issues. Thus, if 25 stocks advance (5%) and 475 stocks decline (95%), AD Percent equals -90% ((25 - 475)/500).
The chart below shows the S&P 500, S&P 500 AD Percent and the S&P 500 AD Line. The index fell 11 of the last 14 days and recorded new lows the last four days. AD Percent joined suit with negative readings 13 of the last 14 days. Thus, AD Percent was negative even when the index closed higher on December 10th and 18th.
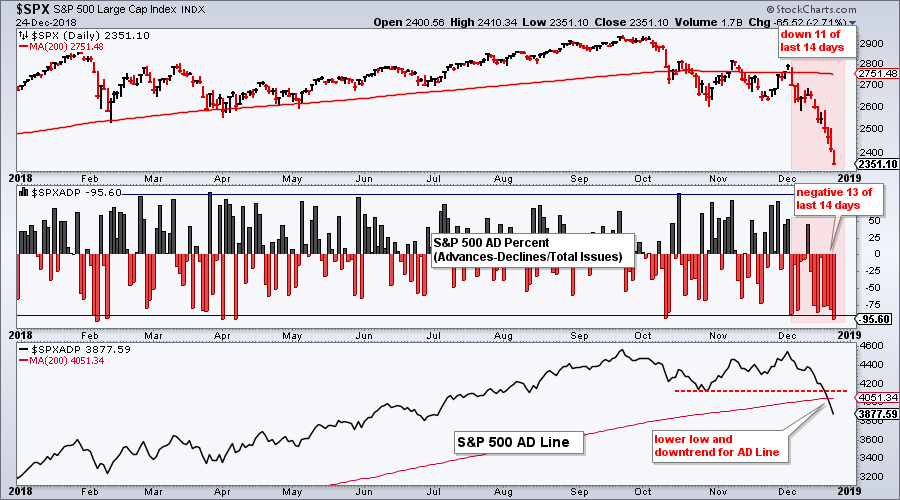
The bottom window shows the AD Line moving below its October low and below its 200-day SMA for the first time since February 2016. This is a long-term bearish signal for breadth and it confirms what we are already seeing on the S&P 500 price chart.
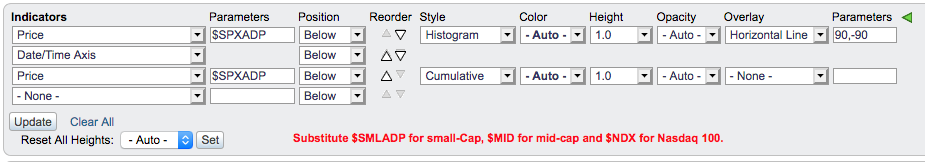
The image below shows the settings used to create these indicators. Chartists can substitute $SML, $MID and $NDX for $SPX to chart these indicators for the S&P Small-Cap 600 S&P Mid-Cap 400 and Nasdaq 100 (e.g. $NDXADP....). You can also substitute the sector SPDR symbols to chart these indicators for each sector (e.g. XLKADP...).
On Trend on Youtube - Review & Preview
The first video provides a preview of what to watch as we head into 2019. Note that this is NOT a forecast. The second video is a review of the big technical events in 2018. There were few gainers in 2018 and lots of losers. In addition, several key groups moved from 52-week highs to 52-week lows in just a few months.
2019 Preview
- 12 Breadth Indicators to Monitor
- Volatility has Yet to Spike
- Defensive Groups Not Immune
- Treasuries Bid for Big Reversals
- Monitor Trends and Benchmark Levels
- Pockets of Strength to Watch in 2019
- Click here to Watch
2018 Review
- Global Overview with 7 PerfChart Groups
- New High to New Low in Just a Few Months
- Evolution of New Lows from October to December
- Underperformers Throughout 2018
- Three Themes Affecting the Financial Markets
- Click here to Watch
- Arthur Hill, CMT
Senior Technical Analyst, StockCharts.com
Book: Define the Trend and Trade the Trend
Twitter: Follow @ArthurHill


