 The Utilities sector is acting as a safe haven for a lot of investors that need to park their money in the stock market because they cannot, or are not allowed to, hold all or significant amounts of cash when markets are going down.
These are the periods when relative strength analysis (and thus Relative Rotation Graphs) can really set themselves apart.
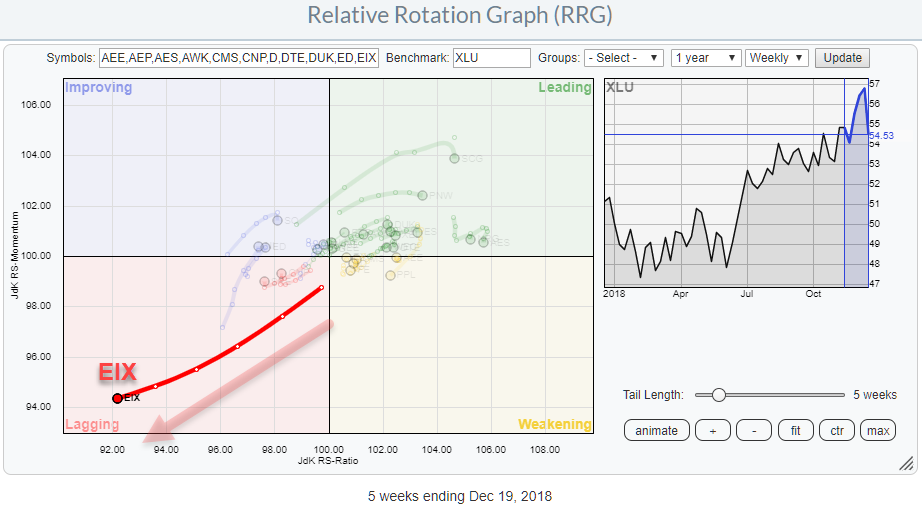
The above chart shows the RRG for the members of the Utilities sector against XLU as the benchmark.
If you need to beat a benchmark it is often, almost always, very important to know what NOT to buy. And this is often counter-intuitive as most of us focus on what the want to buy and not necessarily what to avoid.
In this universe of Utility jstocks, there are two stocks/tails that immediately stand out. These are PCG and EIX. In the RRG above I have taken out PCG as it is so weak and so deep inside the lagging quadrant that it is distorting the rest of the picture.
Taking out PCG makes EIX stand out from the rest of the universe with a long tail pointing South-West and heading further into negative territory.
Bringing up the regular chart for EIX makes the picture even more clear.
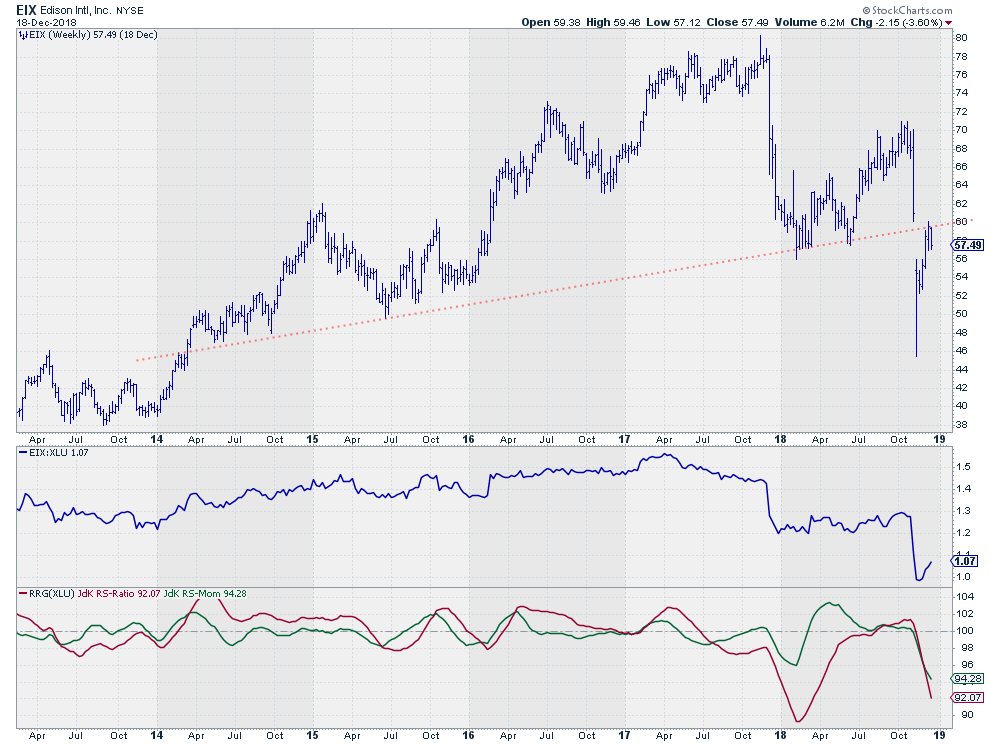 After an initial improvement in October and early November EIX fell sharply, completely turning the technical picture upside down. After the first steep drop one could argue that it was still above the rising support line but after the second drop that created a big gap in the price chart, all positives were out of the window.
The relative strength moved from a sideways to bottoming back to a downtrend pushing EIX into the lagging quadrant. Last week the recent rally closed the gap at $60 which is lining up with the old support line that now acts as resistance.
Upside potential is now limited to double resistance at $60 while downside risk is all the way down to the first support level at its recent low at $46. This is a risk/reward ratio that is better avoided.
My regular blog is the RRG blog If you would like to receive a notification when a new article is published there, simply "Subscribe" with your email address using the form below.
Julius de Kempenaer | RRG Research
RRG, Relative Rotation Graphs, JdK RS-Ratio, and JdK RS-Momentum are registered TradeMarks ®; of RRG Research
Follow RRG Research on social media:
Feedback, comments or questions are welcome at Juliusdk@stockcharts.com. I cannot promise to respond to each and every message but I will certainly read them and where reasonably possible use the feedback and comments or answer questions.
If you want to discuss RRG with me on SCAN, please use my handle Julius_RRG so that I will get a notification.
