 Despite a 15% surge the prior 17 days, the Nasdaq 100 ETF (QQQ) remains below its flattening 200-day SMA and the ETF formed a rare evening star candlestick pattern over the last three days.
First and foremost, I think the long-term trend is down for QQQ. The ETF recorded a 52-week low in December and remains below the 200-day SMA. Even though a 15% advance is impressive, this advance is still in the shadow of an even larger decline (-16.9%). The early December high marks the last peak where the bulls lost control and a break above this high is needed to reverse the bigger downtrend.
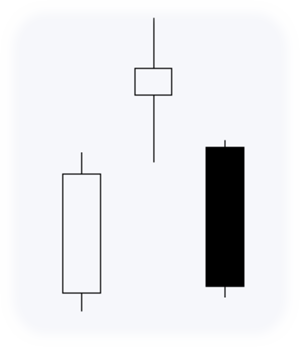
I am highlighting a bearish candlestick reversal because the bigger trend is down. Thus, it is in harmony with the bigger downtrend. I would not highlight this pattern if the bigger trend was up. The evening star pattern is a relatively rare three-candlestick reversal. It forms with a long white candlestick, a gap up and indecisive candlestick and then a gap down and long black candlestick. The bulls were in control with the long white candlestick. The middle candlestick shows indecision because the open-close range is small and in the middle of the high-low range. The bears took control with the third candlestick and forged a short-term reversal.
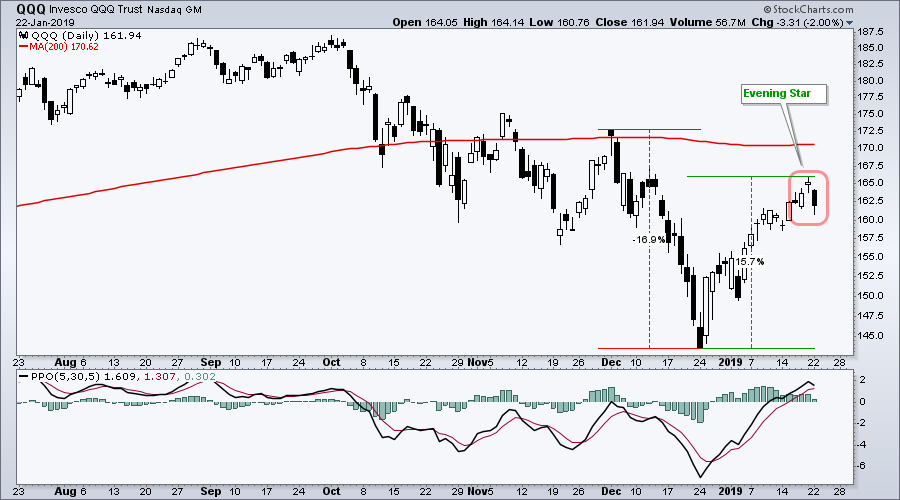
Now what? First, keep in mind that candlestick reversal patterns are short-term and only valid for a few days. Second, the other major index ETFs (SPY, IWM) did not form evening star reversal patterns, even though they also fell on Monday. The evening star in QQQ provides the first sign that the big counter-trend bounce is ripe for a rest or even a reversal. The indicator window shows the PPO (5,30,5) still above its signal line so momentum has yet to turn. Watch for a move below the signal line for further confirmation of a short-term downturn. You can also find evening star patterns on our Predefined Scan Page.
On Trend on YouTube
To Chase or Not to Chase
- Volume is not What is Used to Be
- 2008: Bear Bounce and Bullish Setup
- 2010: Big Bounce and Big Pullback
- 2011: Retracement and Bull Flag
- 2014: October Volatility
- 2015: Volatility and BREXIT Vote
- 2019: What Now?
- Click here to Watch
- Arthur Hill, CMT
Senior Technical Analyst, StockCharts.com
Book: Define the Trend and Trade the Trend
Twitter: Follow @ArthurHill


