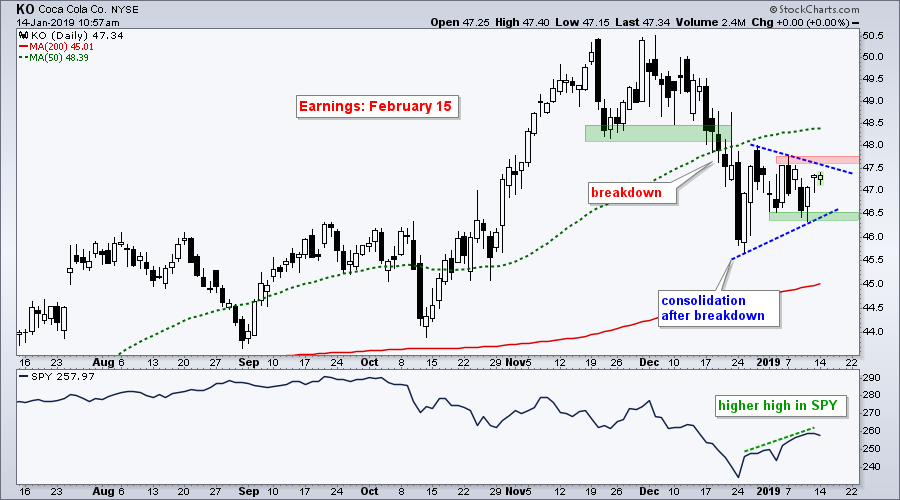
 Stocks surged over the last 12 days with the S&P 500 gaining over 10% and moving above its late December high. Coca-Cola (KO) was leading the market with a new high in November, but did not partake in the broad market rally here in January. SPY is up around 3.63% year-to-date, but KO is flat for the year. Moreover, a bearish continuation pattern is forming on the chart.
The price chart below shows KO breaking support with a sharp decline in the second half of December. The stock consolidated after this breakdown as a pennant formed. A consolidation after a sharp decline is a bearish continuation pattern and a break below last week's lows would signal a continuation lower. The downside target would be to around 44.
Note that KO is still above the rising 200-day SMA and hit a new high just two months ago. Thus, one could argue that the long-term trend is up. While the December breakdown and underperformance in 2019 are bearish, keep an open mind because an upside breakout at 47.7 would be bullish.
On Trend on YouTube
Big Picture Dictates Trading Bias
- Review of the Long-term Picture ($SPX weekly)
- SPY and QQQ Become Short-term Overbought
- Where are the New Highs and Uptrends!?
- Sorting Sectors Using CandleGlance
- XLC and XLY Lead Bounce as XLU Looks Vulnerable
- Click here to Watch
- Arthur Hill, CMT
Senior Technical Analyst, StockCharts.com
Book: Define the Trend and Trade the Trend
Twitter: Follow @ArthurHill


