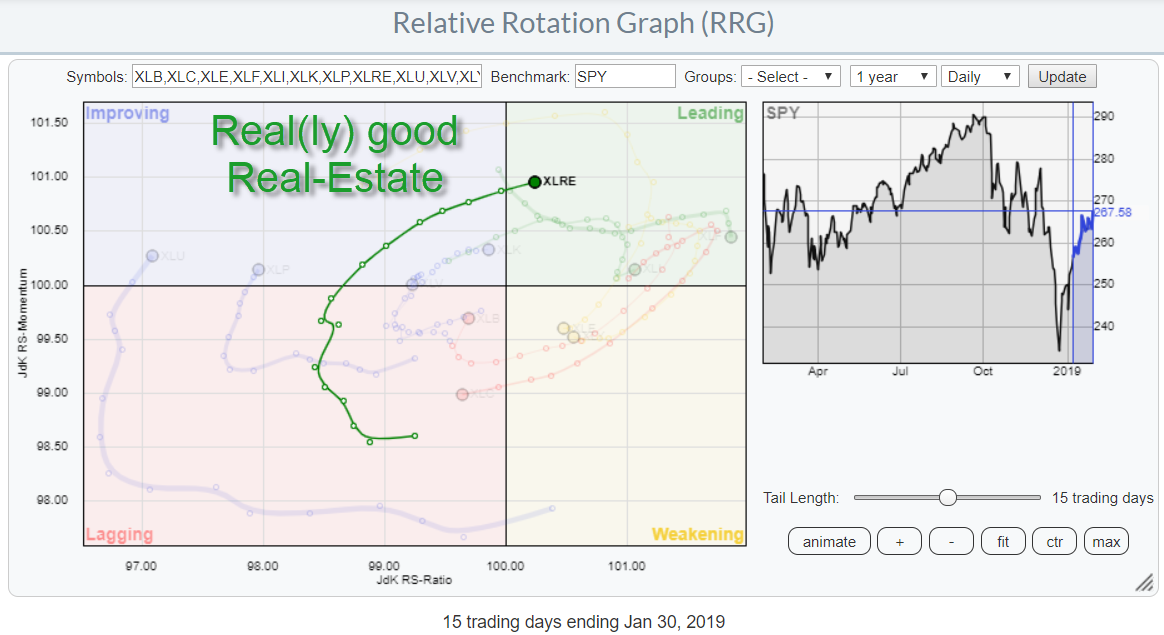
 The Relative Rotation Graph for US sectors shows a remarkably steady rotation for the Real-Estate sector. This is a daily RRG showing a 15 day tail, or three weeks. Yesterday XLRE crossed over into the leading quadrant and is now the only sector inside the leading quadrant at a solidly positive RRG-Heading.
Real Estate Select Sector SPDR Fund - XLRE
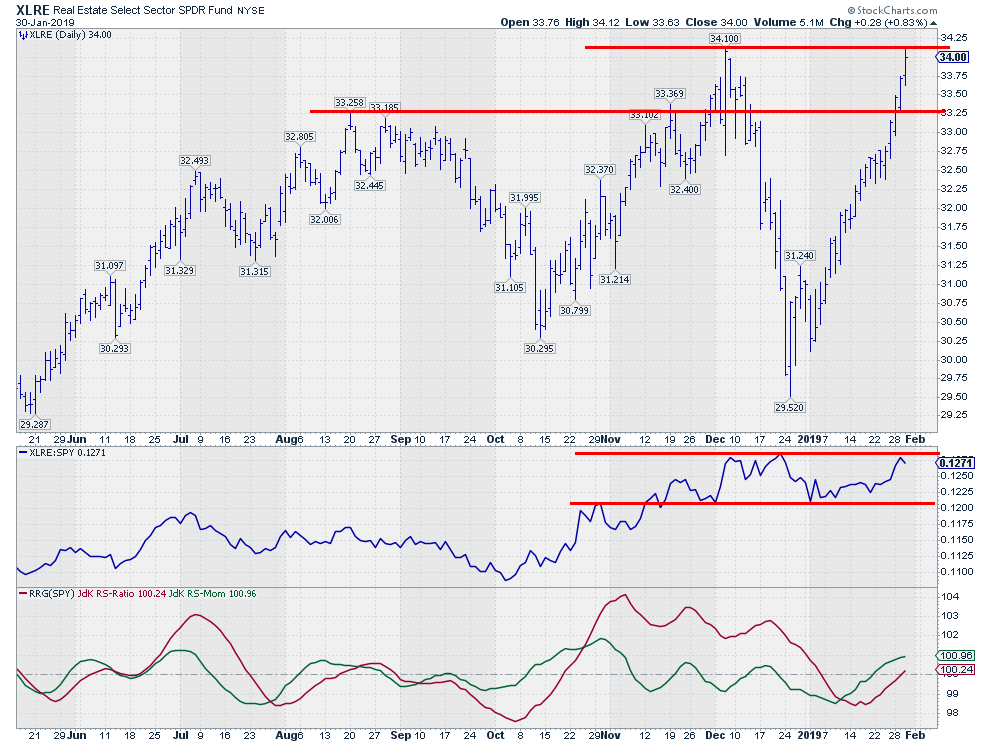 The daily price chart for XLRE shows a steep rally from its late December low to current levels where it is running into overhead resistance. $34.10 (or $34.50 unadjusted) is the level to watch for a break higher. A break will push the Real-estate sector to new all-time-highs which usually is a good sign and accelerates an upward move.
However, there is heavy overhead resistance looming at the level of the early December peak. A similar situation is visible in the relative strength line where the market is pushing against horizontal resistance coming off two prior highs.
This makes the current rally vulnerable at these levels, XLRE really needs to break beyond these overhead resistance levels and keep momentum, both price, and relative, to continue this move.
It is one of these make or break situations; Taking out resistance will very likely cause a further rally. Failing to do so will end in a peak against resistance and a corrective move lower.
This makes XLRE a chart that should not be ignored at the moment.
My regular blog is the RRG blog If you would like to receive a notification when a new article is published there, simply "Subscribe" with your email address using the form below.
Julius de Kempenaer | RRG Research
RRG, Relative Rotation Graphs, JdK RS-Ratio, and JdK RS-Momentum are registered TradeMarks ®; of RRG Research
Follow RRG Research on social media:
Feedback, comments or questions are welcome at Juliusdk@stockcharts.com. I cannot promise to respond to each and every message but I will certainly read them and where reasonably possible use the feedback and comments or answer questions.
If you want to discuss RRG with me on SCAN, please use my handle Julius_RRG so that I will get a notification.


