 The overall trend for Amazon shifted from bullish to bearish in October and RSI caught this shift.
Before looking at RSI, let's review price action and the bigger trend at work. The chart shows Amazon moving to a new high in early September, forming a lower high in early October and breaking support with a sharp decline in October. The index fell further in the second half of October and broke the 200-day SMA for the first time since March 2016. The stock then bounced around the 200-day SMA for a few weeks and plunged in December. This was the first 52-week low in Amazon since January 2015. Clearly, this is not a garden variety decline.
Amazon rose from the ashes in January and even closed above its 200-day SMA day last week. This bounce, however, is still considered a counter-trend bounce with a bigger downtrend. The red zone marks resistance from the recent peaks and a break above this zone is needed to record a higher high and reverse the overall downtrend. The green zone marks short-term support and a break here would argue for a continuation of the bigger downtrend.
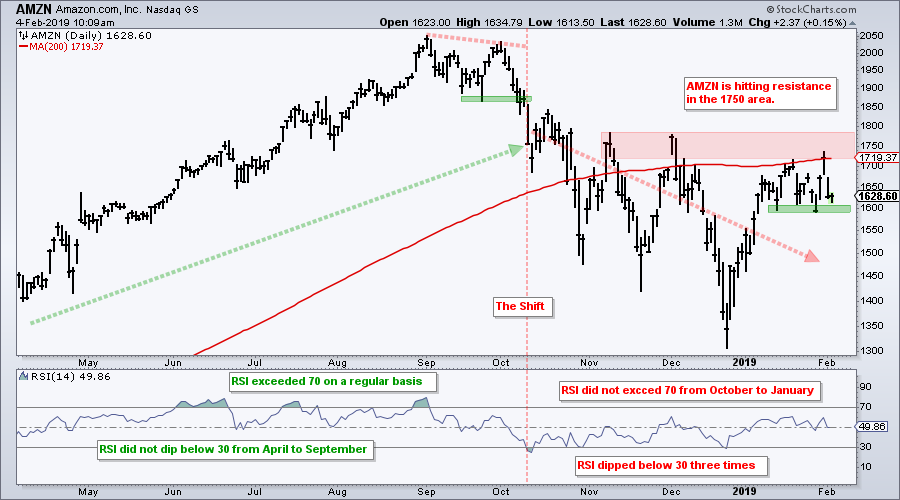
And now for that big shift in RSI. Many traders use RSI as a momentum oscillator, but it can also be used to identify trends and trend reversals. The indicator window shows 14-day RSI moving above 70 several times from June to September and then below 30 several times from October to December. The red vertical line marks a clear shift in the RSI range. Prior to October, the last dip below 30 occurred in November 2016. Thus, RSI held above 30 from December 2016 to September 2018. In addition, the indicator exceeded 70 on numerous occasions during this stretch. Needless to say, AMZN trended higher during this period when RSI held above 30 and regularly exceeded 70.
RSI shifted in October as it dipped below 30 twice in October and once in December. Moreover, RSI has not exceeded 61 since September. 61 is not a particularly important level, but it does show that upside momentum is not that strong. A move above 70, in contrast, would show strong upside momentum. Thus, I would consider the trend down as long as RSI dips below 30 and fails to exceed 70.
On Trend on StockChartsTV
Note that On Trend can be seen on Tuesdays and Thursdays as 10:30AM and 11:00 AM ET on StockChartsTV. Shows are then archived on our Youtube Channel.
- Arthur Hill, CMT
Senior Technical Analyst, StockCharts.com
Book: Define the Trend and Trade the Trend
Twitter: Follow @ArthurHill


