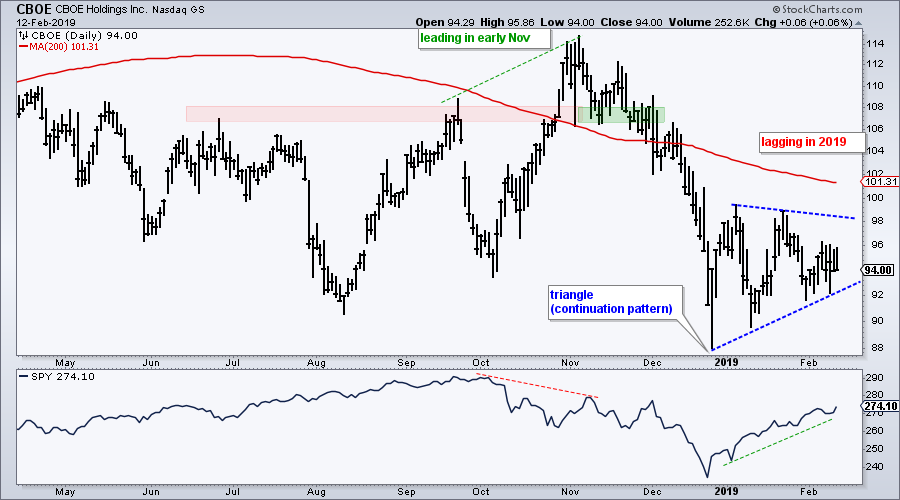
We are 29 trading days into 2019 and the S&P 500 is up a very respectable 9.49%. Furthermore, some 465 stocks in the S&P 500 are up year-to-date, which means 35 are down year-to-date. CBOE Holdings (CBOE) is one of these stocks (-3.91% year-to-date) and a bearish continuation pattern is taking shape on the price chart.
The chart shows CBOE breaking out with a surge in late October and outperforming the market in early November. This breakout did not hold as the stock fell back below the breakout zone in early December and back below the falling 200-day SMA. Even though the stock broke above the 200-day SMA in late October, notice that the 200-day SMA continued falling and never turned up.
After falling to a 52-week low in December, the stock consolidated with a triangle over the last six weeks. A triangle after a decline is typically a bearish continuation pattern and a break below 92 would argue for further weakness. Notice that the stock is seriously underperforming over the last few weeks because SPY moved above its late January high.
On Trend on YouTube
Stocks Refuse to Back Down
- QQQ and SPY Hold as IWM Outperforms
- XBI Outperforms IBB (plus ITB, XRT, KRE)
- Focus on Payments Industry (SQ, V, MA...)
- Weakness in Media Land (CBS, NWSA, DIS...)
- Combining Daily and Weekly Analysis (FFIV)
- Stock Setups: ISRG, FORM, FNSR, IONS, VCEL
- Click here to Watch
- Arthur Hill, CMT
Senior Technical Analyst, StockCharts.com
Book: Define the Trend and Trade the Trend
Twitter: Follow @ArthurHill


