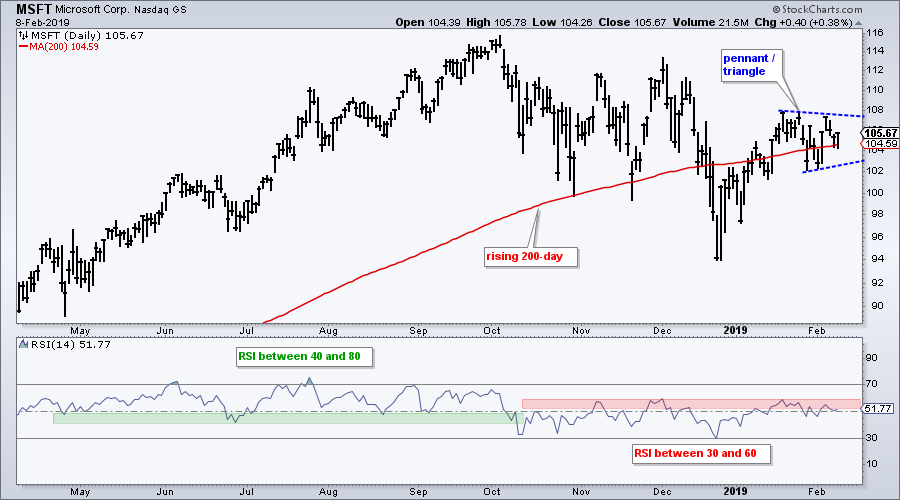
Microsoft is battling the rising 200-day moving average and making a bid to shift momentum back to the bulls.
The chart shows MSFT falling along with the market from October to December and then rebounding sharply in January. The stock is currently consolidating around the 200-day SMA with a pennant, which is a short-term bullish continuation pattern. This pattern represents a consolidation (rest) after an advance and a breakout at 108 would signal a continuation higher.
 The indicator window shows 14-day RSI shifting from a bullish range to a bearish range in October. Notice how RSI ranged between 40 and 80 as the stock advanced from April to October. RSI broke below 40 in October and has since ranged from 30 to 60. Notice how RSI failed in the 50-60 zone from November to January. Look for a break above 60 to put momentum back in the bullish range.
On Trend on YouTube
The Moment and the Squeeze
- The Moment of Truth Arrives
- XLF Stalls Out (Plus JPM, BAC, WFC, GS, MS)
- Careful with ITB (Plus DHI, HD, LEN, PHM)
- Chart and Scan the Bollinger Band Squeeze
- 5 Squeeze stocks: ALK, BIIB, DIS, LYV, WBA
- Click here to Watch
To Chase or Not to Chase
- Reviewing the Turn of the Month
- Two Parts to an Uptrend
- HACK and SKYY Lead Tech ETFs
- Six Healthcare Leaders
- Four Teetering Tech Titans
- Stocks to Watch
- Click here to Watch
- Arthur Hill, CMT
Senior Technical Analyst, StockCharts.com
Book: Define the Trend and Trade the Trend
Twitter: Follow @ArthurHill


