 On the weekly Relative Rotation Graph for US sectors, XLI, the Industrials sector is crossing over into the leading quadrant from improving. This indicates further improvement for Industrial stocks compared to other segments of the market.
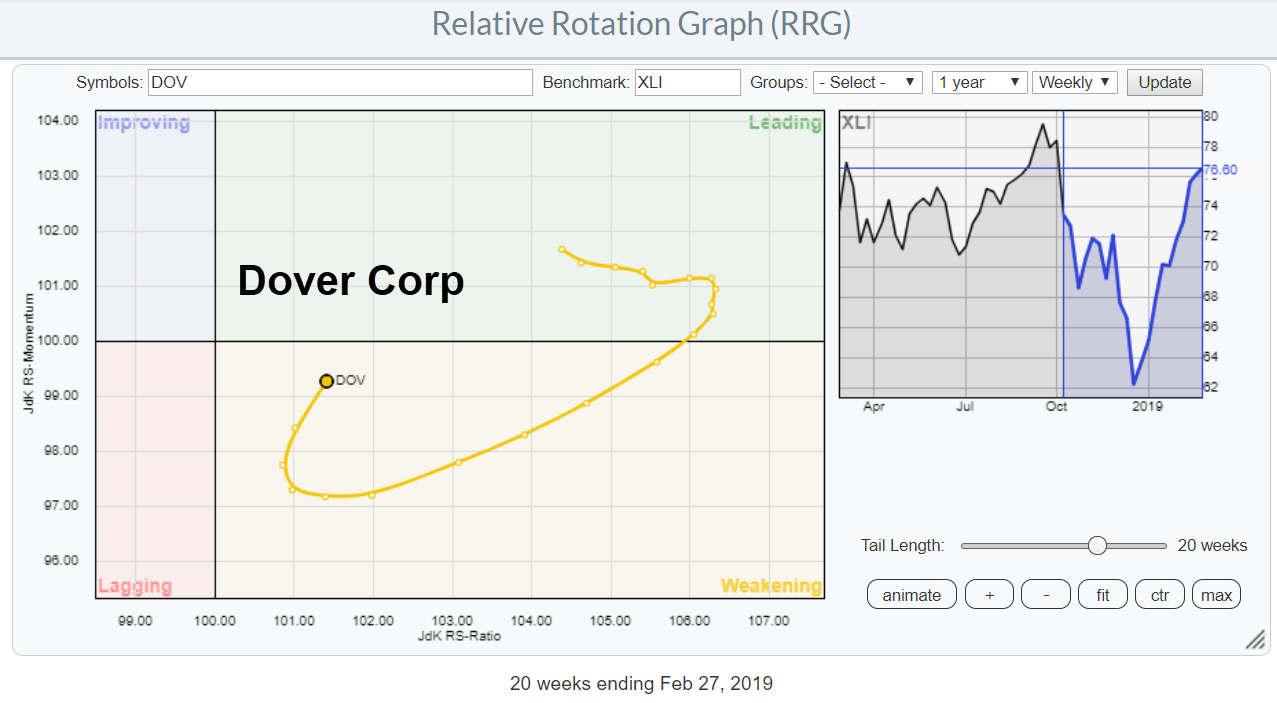
While zooming in on the RRG for Industrial stocks against XLI I noted the rotation of DOV inside the weakening quadrant.
When a stock is at the right-hand side of the RRG, it means that its relative trend against the benchmark is already rising. A rotation into the weakening quadrant indicates a loss of relative momentum for that uptrend.
In strong trends rotations can complete at the right (strong relative trends) or the left (weak relative trends).
The rotational pattern that DOV is currently tracing out suggests that it is ready for a new period of outperformance vs XLI.
Dover Corp - DOV
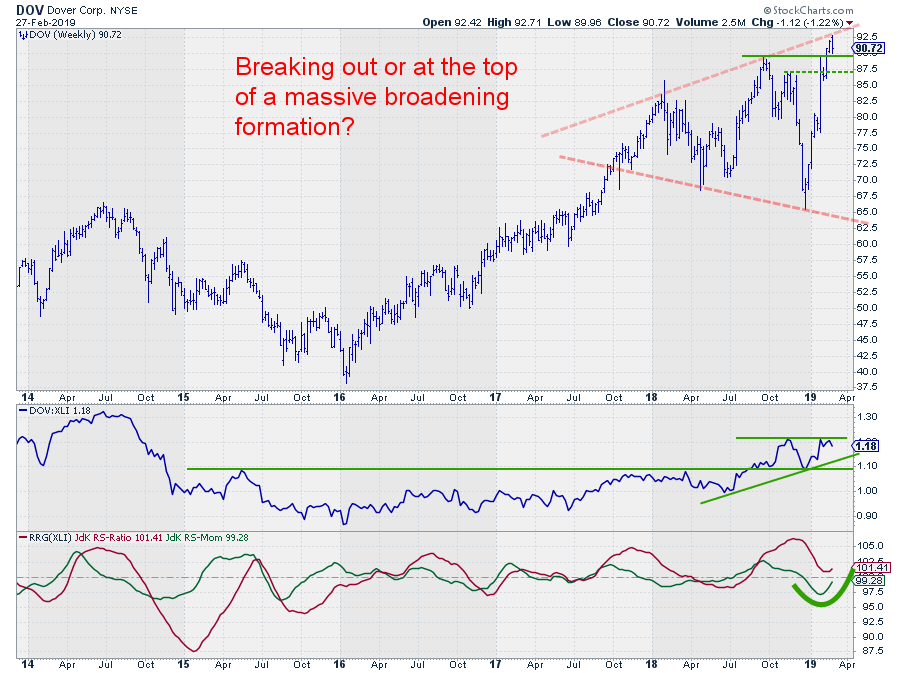
 On the price chart, DOV is breaking to new highs and the RS- and RRG-Lines confirm the recent improvement in relative strength. That looks positive and upward breaks, in general, are bullish.
At the same time, there are a few observations that could have more bearish implications.
Mid-2018 the RS-Line broke to new 3-year highs and subsequentially tested that breakout level as support. The rise off of that relative support level caused the curling up of the tail inside the weakening quadrant. At the moment the RS-Line is pushing against its recent high. The RS-Line needs to break higher in order to maintain the strong rotation and continue the relative uptrend against XLI.
If that break in RS does not happen, relative strength has plenty of room to the downside to deteriorate.
Apart from the break to new highs in the price chart, a massive broadening formation can also be detected with DOV now pushing against the upper boundary of that formation.
Broadening formations are typical topping formations that occur in times of high volatility for that stock.
This puts DOV at crossroads with the break to new highs and strong relative strength arguing for higher prices while a failure to break higher in relative strength in combination with a potential broadening formation would implicate serious downside risk.
From a swing trading perspective, a potential approach could be to buy DOV at current levels to benefit from a move higher after the break and anticipating a continuation of the strong rotation back to the leading quadrant on the RRG. But keeping a stop and reverse scenario in place as a backup plan.
Levels I am watching for reversing the bullish scenario are $89 if you're very aggressive or $86 if we want to give the market a little bit more leeway. These are the levels of the September and November peaks which should now act as support levels.
Either scenario provides a very decent risk/reward ratio.
If you are in the New York area 10-12 March please stop by and Join me at the TradersEXPO
My regular blog is the RRG blog If you would like to receive a notification when a new article is published there, simply "Subscribe" with your email address using the form below.
Julius de Kempenaer | RRG Research
RRG, Relative Rotation Graphs, JdK RS-Ratio, and JdK RS-Momentum are registered TradeMarks ®; of RRG Research
Follow RRG Research on social media:
Feedback, comments or questions are welcome at Juliusdk@stockcharts.com. I cannot promise to respond to each and every message but I will certainly read them and where reasonably possible use the feedback and comments or answer questions.
If you want to discuss RRG with me on SCAN, please use my handle Julius_RRG so that I will get a notification.


