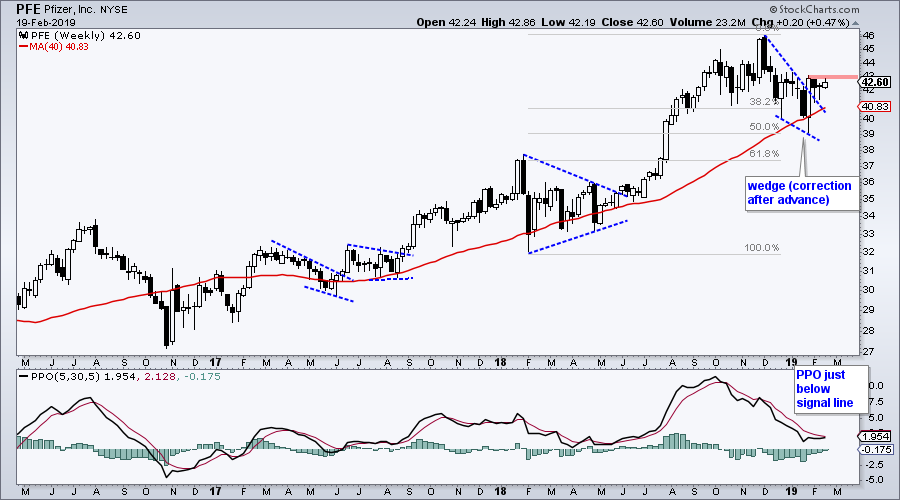
When sitting down to a chart, or even standing, establishing the direction of the bigger trend is the first task. The direction of this trend establishes my trading bias and tells me where to focus. My trading bias is bullish when the trend is up and this means I focus on bullish setups. Among other things, this includes pullbacks within the uptrend (wedges), bullish continuation patterns (flags) or upturns in momentum (PPO).
Pfizer shows a classic case-in-point. The stock is in a long-term uptrend because it recorded a 52-week high in November and remains above the rising 40-week SMA. PFE corrected into January with a falling wedge that retraced around 50% of the prior advance. Thus, this could be a two steps forward and one step backward sequence.
The stock broke out of the wedge with a big surge four weeks ago and this breakout is largely holding as the stock consolidates in the 42-43 area. A break above 43 would signal an end to this consolidation and a resumption of the breakout. The indicator window shows the PPO (5,30,5) flattening in positive territory and starting to turn up. A move above the signal line would be bullish for momentum.
On Trend on YouTube
Finance and Biotech ETFs Break Out
- Changing of the Guard (Low Vol in Vogue)
- Finance Sector Springs to Life (XLF and 4 stocks)
- Flags Flying at Regional Banks (KRE and 4 stocks)
- Biotech Breakouts (IBB, XBI and 5 stocks)
- China, Korea and Vietnam Lead Asia
- Click here to Watch
- Arthur Hill, CMT
Senior Technical Analyst, StockCharts.com
Book: Define the Trend and Trade the Trend
Twitter: Follow @ArthurHill


