 AT&T (T) was one of the worst performing stocks in 2018 with a 20% decline and 52-week low in late December. 2019 is starting out much better with a double-digit gain and a break above the November-February highs, which also mark neckline resistance of an inverse head-and-shoulders pattern.
The inverse head-and-shoulders pattern is a bullish reversal pattern that marks a trend change (from down to up). The left shoulder formed from late October to early December, the head with the December low and the right shoulder with the February-March lows. The peaks across the pattern mark neckline resistance and a break above this resistance zone confirms the pattern.
T is breaking above resistance today and the stock is above its 200-day SMA. However, the 200-day SMA is still falling, the 50-day SMA is below the 200-day SMA and the stock is not even close to a 52-week high. Thus, the long-term evidence is still mixed as far as the actual trend is concerned.
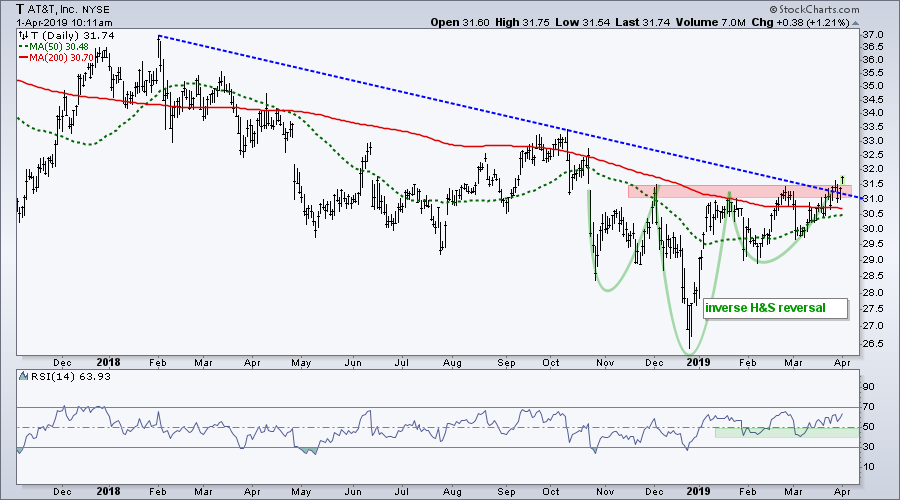
The indicator window shows an improvement in momentum as RSI held the 40-50 zone the last three months. This shows that pullbacks were contained over the last few months. Upside momentum is still not impressive because RSI has yet to exceed 70.
Overall, the cup is half full for AT&T. I would watch the 50-day and the 40-50 zone for RSI going forward. The head-and-shoulders is valid as long as both hold. A close below the 50-day and RSI move below 40 would warrant a re-evaluation.
Programming Note: I will be joing Tom and Erin on MarketWatchers Live as we kick off the week celebrating 20 years of StockCharts.com. I will be talking about how to improve performance when using the MACD and the PPO. Today at 12PM ET on StockChartsTV.
On Trend on YouTubeOn Trend on YouTube
Big Techs Lead as Banks Stall
- Watching Junk Bond Spreads and JNK
- XLI Hits Make or Break Level (plus 5 Stocks)
- Key Stocks at Inflection Points
- Spotting Stocks with Strong Uptrends
- Click here to Watch
- Arthur Hill, CMT
Senior Technical Analyst, StockCharts.com
Book: Define the Trend and Trade the Trend
Twitter: Follow @ArthurHill


