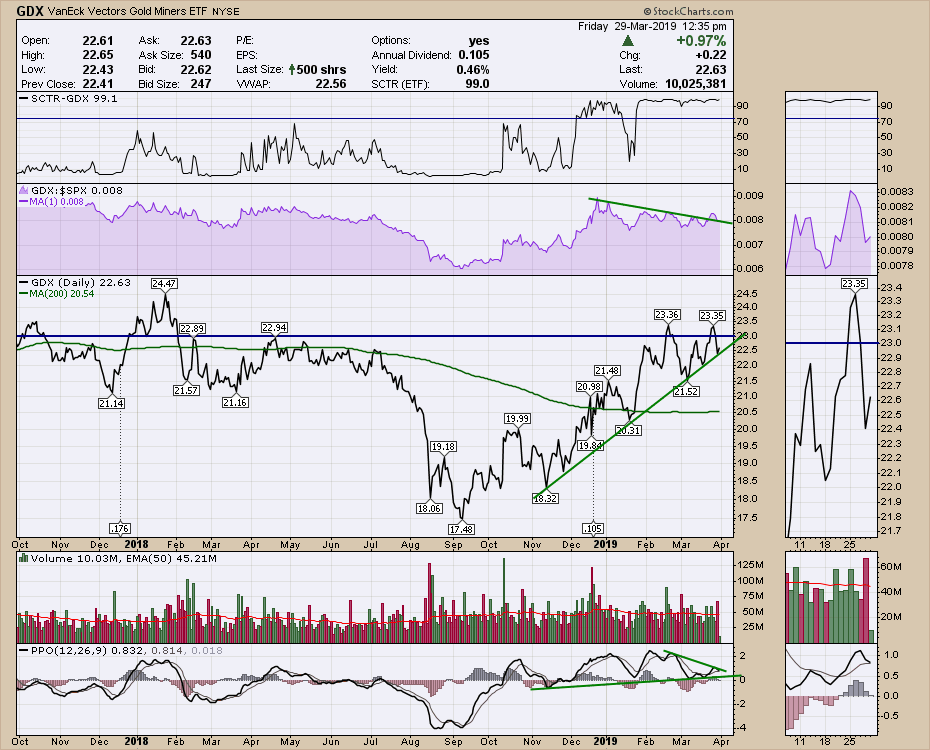
On Tuesday, I published an article on the breakout in the gold miners, wherein I showed three charts that supported the thesis of Gold and gold miners going higher. One of the benefits of technical analysis is knowing when you are wrong. With the reversal of the gold chart at a critical level, the expectation of a down movee in Gold is now in play. Why the quick flip?
When trading a breakout where the breakout fails to hold, it can be more important to recognize the failure than to stubbornly hold on to the trade. This time, it is the gold miners being hit by the failed breakout. Going forward, it will be important to watch for support to hold at the trend line.
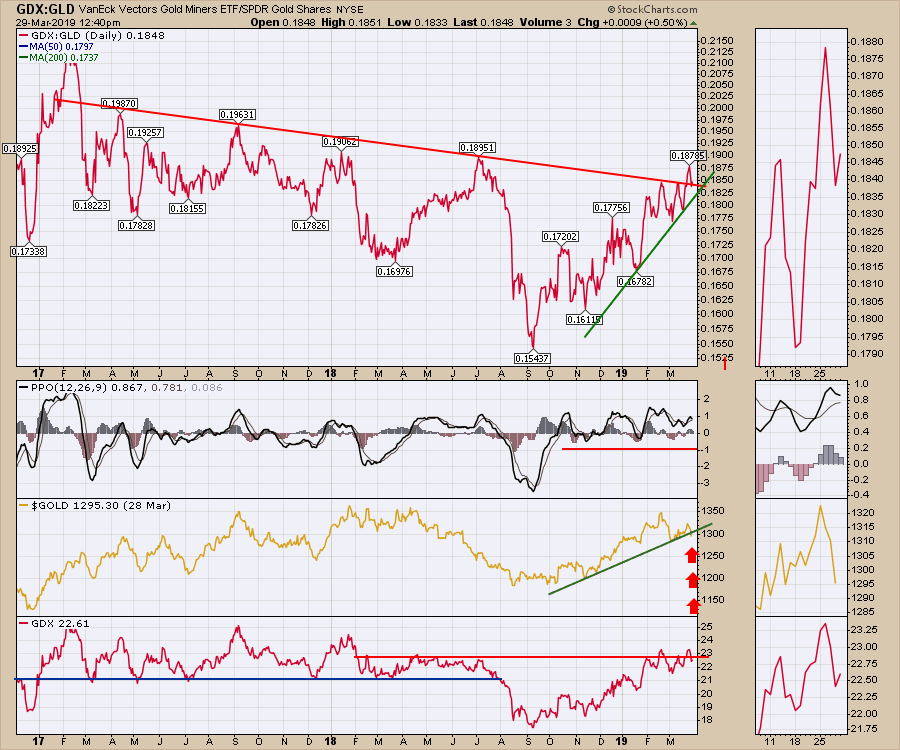
 There are other clues that the trade failed as well. After breaking a two-year trend line in a ratio of the gold miners to gold, that breakout failed as well. A break of the green uptrend line would cement the trouble ahead.
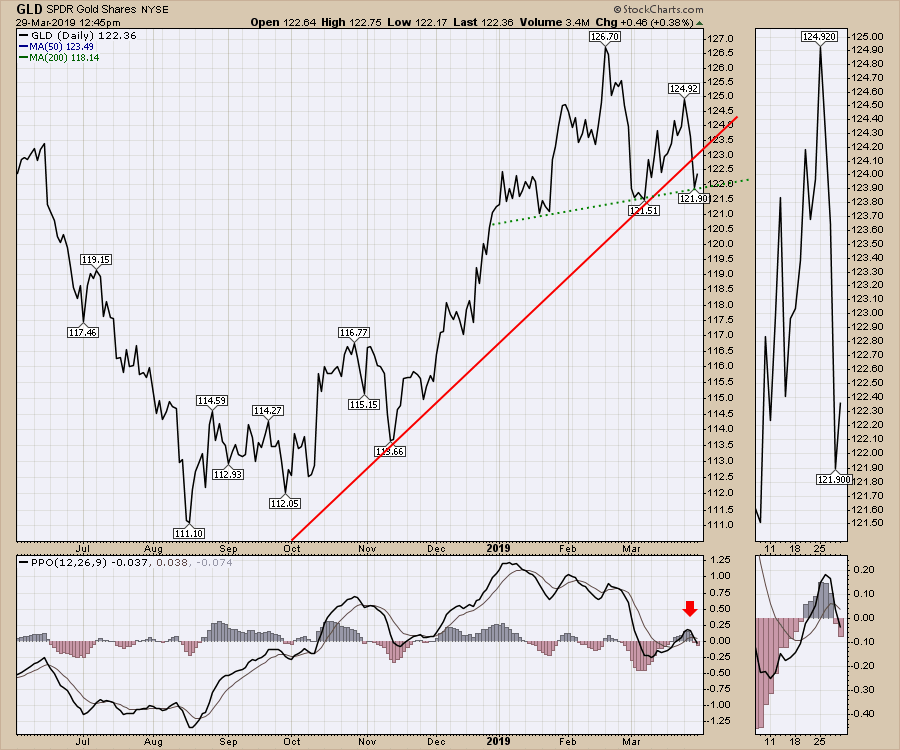
 The chart of Gold also broke its main uptrend line. Another concern is the small head-and-shoulders topping structure. A break below the early March low would set up a series of lower lows following a lower high. Lower lows, lower highs - that is the definition of a downtrend. Momentum is also rolling over right at zero.
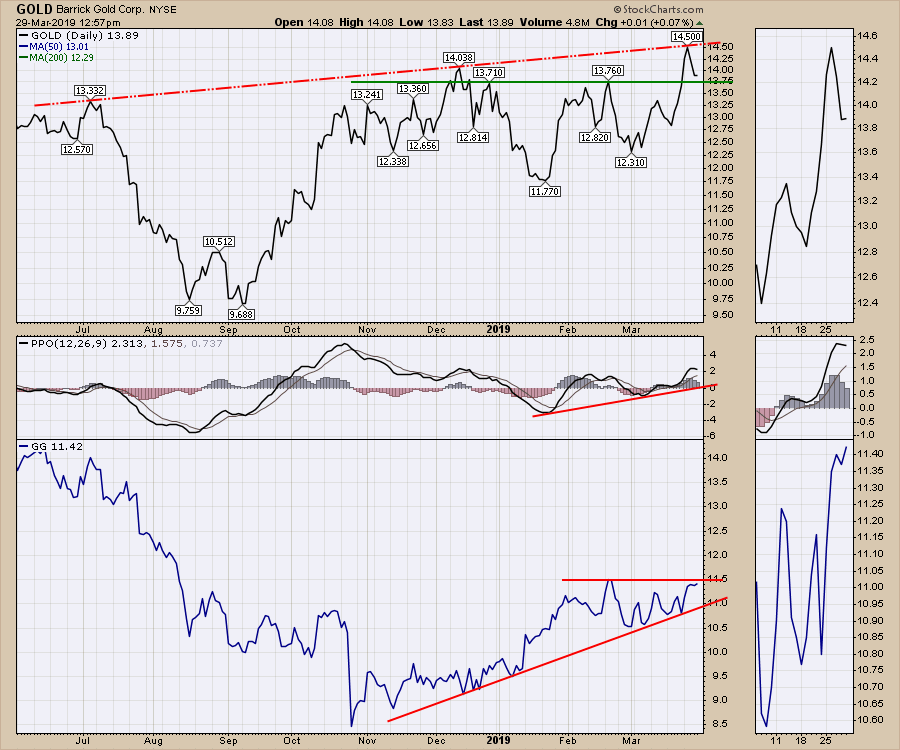
 These charts also made it look like this thing was ready to blast off. Barrick Gold, the biggest gold miner was breaking out to new highs. Now that is in question. Goldcorp never did break out.
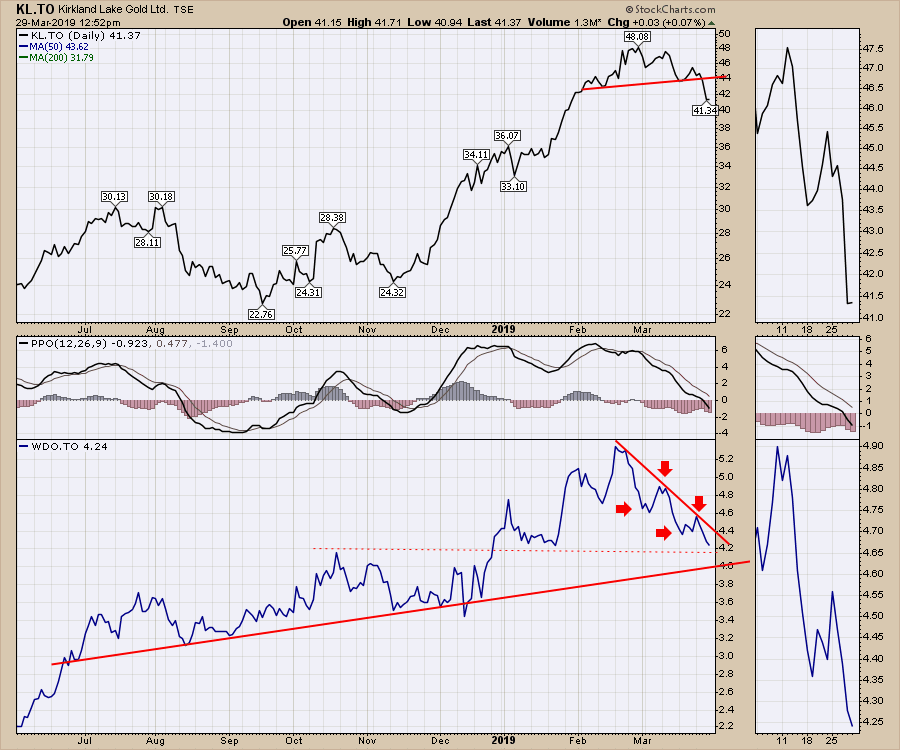
 Lastly, two other things are starting to bother me about the gold miners, but I had thought a breakout would resolve the divergence to the upside. KL.TO and WDO.TO have been leaders, but both are now making topping patterns with lower highs and lower lows. To me, that suggests the rally might be ending.
 At this point, I have to stop trading gold to the upside until some clarity shows up. This was a defining breakout and it appears to have failed.
Good trading,
Greg Schnell, CMT, MFTA


