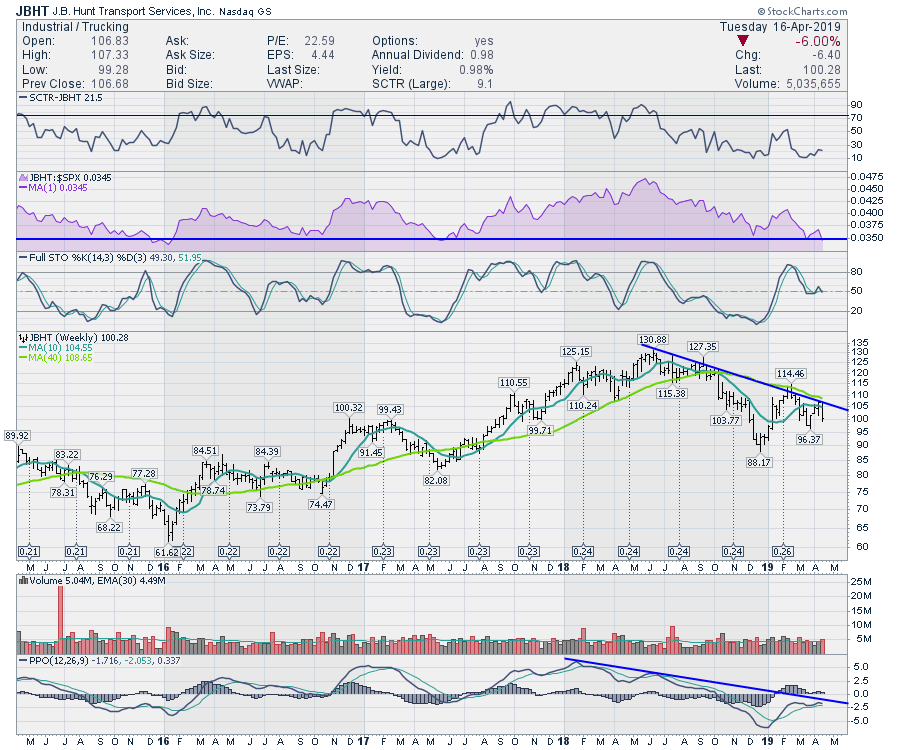
JB Hunt (JBHT) announced results that were not as positive as expectations and the stock dropped in response. The timing of the news happened to stall the stock right at the 40-week moving average. While the global economy has been rallying on since the late December lows, a lot of the attention has been focused on the continued growth in freight. JB Hunt is trucking into its 4th quarter of underperforming the $SPX, shown on the area chart with a high showing up last June. These lower highs in a major freight company are not bullish.
 The PPO continues to make lower highs and this bump in the road shows up as the stock was approaching a down-sloping trend line. The PPO is an indicator of momentum, which suggests a need more caution ahead until the slope can change to an uptrend.
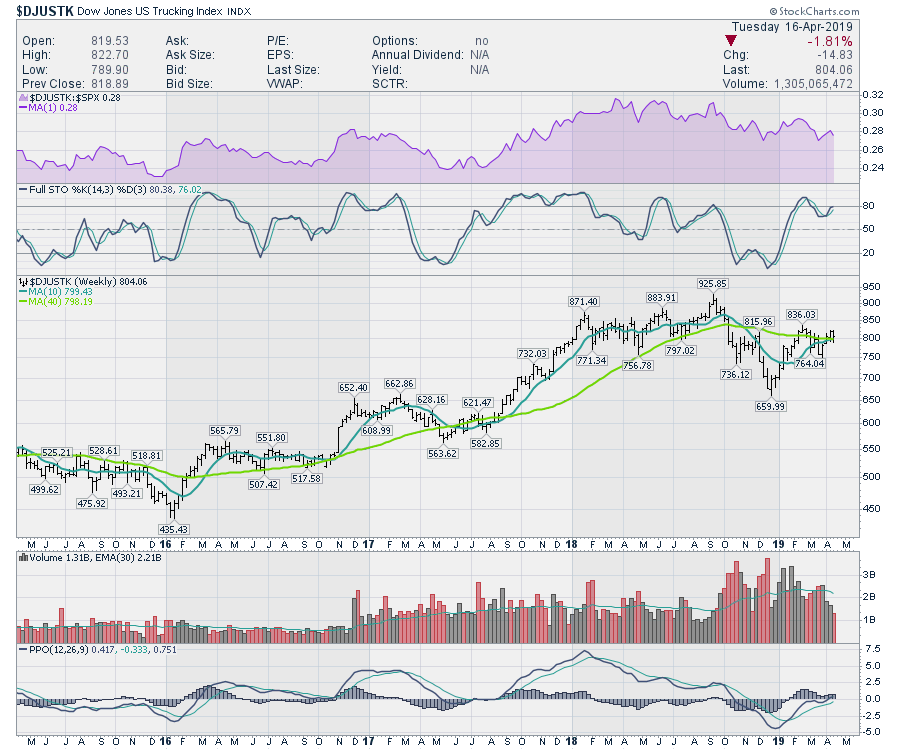
Below is a chart of the trucking industry index. The chart is similar to the JB Hunt chart; further weakness on the industry picture would probably add more fuel to a halt in the old economy. When rallies in industrials, materials and freight-moving weaken significantly, it can be a warning of broader problems.
 While one company may not be the story for the industry, it does suggest that a potential slowdown is occurring. If the stock can start to rally in the face of bad news, that would be very bullish, so a chart change over the next two weeks could be a clue. Don't ignore this chart!
Good trading,
Greg Schnell, CMT, MFTA
Senior Technical Analyst, StockCharts.com
Author, Stock Charts For Dummies
Want to stay on top of the market's latest intermarket signals?
– Follow @SchnellInvestor on Twitter
– Connect with Greg on LinkedIn
– Subscribe to The Canadian Technician


