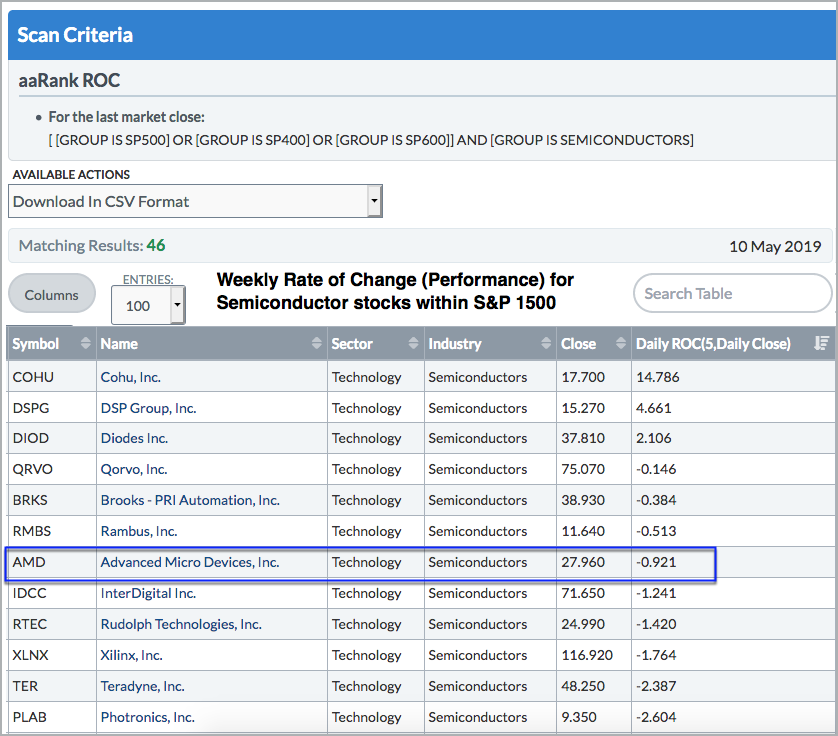
The S&P 500 was down 2% last week and the Nasdaq fell 3%. Stocks that gained on the week showed relative and absolute strength. Stocks that fell less than 2% showed relative strength. The average semiconductor stock within the S&P 1500 was down 5% last week with only 3 of 46 closing higher. AMD did not close higher, but it fell less than 1% and held up much better than the group as a whole. DIOD and QRVO also held up well and have interesting charts. The table below shows the top 12 peforming semiconductor stocks last week. Only three were up and nine were down.

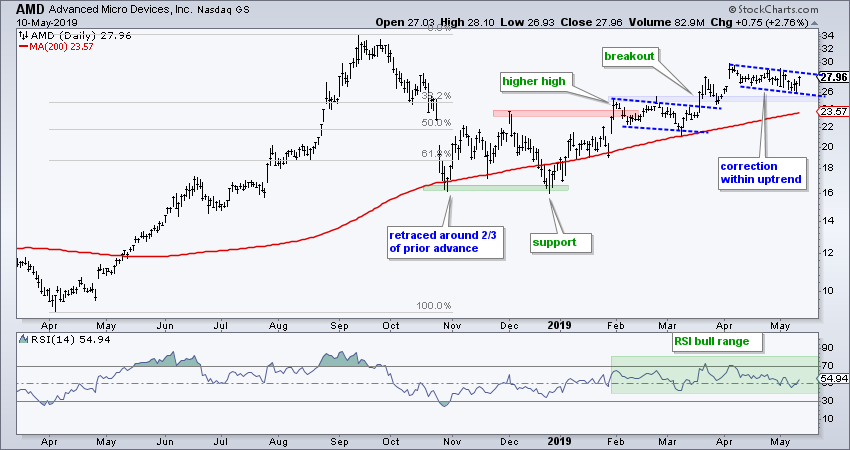
The AMD chart also looks promising. First and foremost, the long-term trend is up because the stock is above its rising 200-day SMA. AMD recorded a new high in September and then fell into early November as it retraced around 2/3 of the prior advance (~10 to 34). After finding support in the 16-17 area twice, the stock broke out in February and continues to trend higher.
Most recently, AMD corrected with a falling channel over the last five weeks. This mild correction is finding support just above the breakout zone from the mid March breakout (25.5-26). A breakout from this pattern would end the corrective period and signal a continuation of the bigger uptrend.
On Trend on Youtube (Thursday, 9-May)
- Big Three Review (SPY, QQQ, IWM)
- Yen Signals Risk Off (plus UUP, FXE)
- Bond ETFs Hold Breakout Zones
- Brokers Hit Resistance (GS, SCHW, ETFC)
- FedEx and UPS Break Down (65-Day RSI)
- Click here to Watch https://youtu.be/dIMIPzRVEn4
Arthur Hill, CMT
Senior Technical Analyst, StockCharts.com
Author, Define the Trend and Trade the Trend
Want to stay up to date with the latest market insights from Arthur?
– Follow @ArthurHill on Twitter
– Subscribe to Art's Charts
– Watch On Trend on StockCharts TV (Tuesdays / Thursdays at 10:30am ET)


