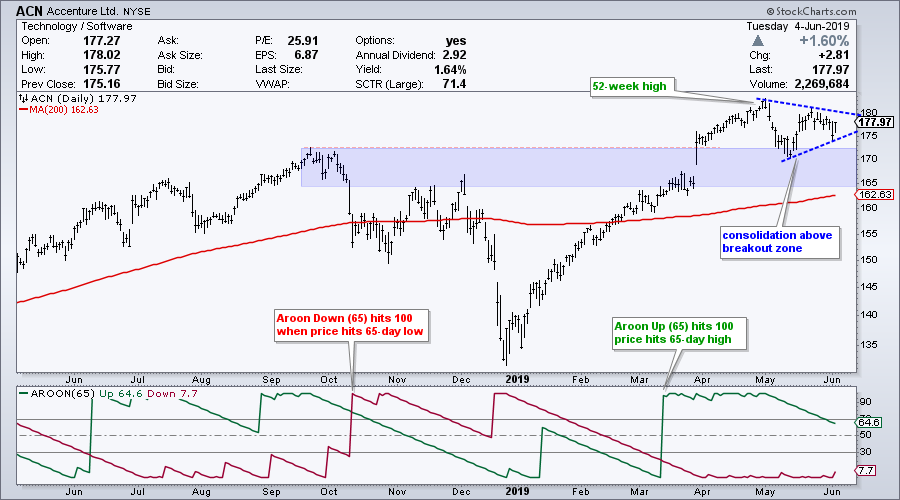
Semiconductor stocks fell hard in May, but many software names held up quite well in May and simply consolidated. Accenture is one such name as the stock held above the breakout zone and simply consolidated the last five weeks.
First and foremost, the long-term trend is up because Accenture (ACN) is above its rising 200-day SMA. In addition, the stock hit a 52-week high in early May and remains above the breakout zone (blue area).
After a gap and surge to new highs, the stock consolidated above the 170 level. I elected to draw the lower line of a triangle after Tuesday's bounce and this looks like a consolidation after a sharp advance. Triangles after advances are typically bullish continuation patterns and a breakout at 180 would signal a continuation higher.
The indicator window shows 65-day Aroon Up and Aroon Down. Note that Aroon Up (65) hits 100 when the stock records a 65-day high and Aroon Down (65) hits 100 when the stock records a 65-day low. ACN started recording 65-day lows in mid October and did not record a 65-day high until mid March. Aroon Up hovered in the 90-100 area as the stock kept recording 65-day highs and then fell back in May. I do not view this as negative because the stock is just moving sideways. A 65-day low or Aroon Down move to 100 would, however, call for a reassessment of the bigger uptrend.
On Trend on YouTube (Tuesday, June 4th)
- Charting with StockChartsACP
- S&P 500 Toys with 200-day
- Parade of Negative Charts (XRT, SPHB...)
- A Few ETFs Held Up in May (VNM, FM)
- Stocks: INCY, HXL, ROLL, TDY, HON
- Click here to Watch
Arthur Hill, CMT
Senior Technical Analyst, StockCharts.com
Author, Define the Trend and Trade the Trend
Want to stay up to date with the latest market insights from Arthur?
– Follow @ArthurHill on Twitter
– Subscribe to Art's Charts
– Watch On Trend on StockCharts TV (Tuesdays / Thursdays at 10:30am ET)


