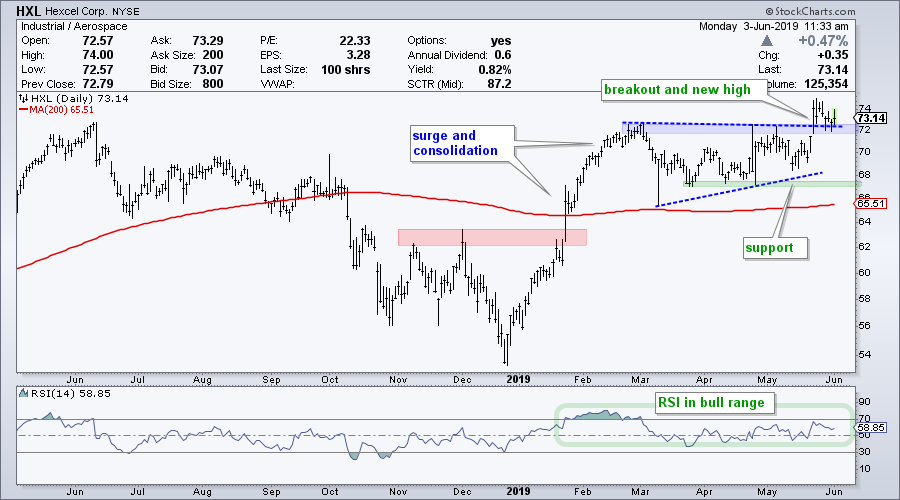
May was a tough month for the broad market indexes and nine of the eleven sectors. Only the Utilities SPDR and Real Estate SPDR advanced in May as the other nine sectors fell. Stocks that closed higher in May bucked some serious selling pressure and could be worth a second look. Hexcel (HXL) is one such stock because it advanced in May and even hit a new high in late May.
The chart shows the stock surging above its 200-day SMA in January and then embarking on a consolidation from February to May. A triangle formed as the stock digested these gains and HXL broke out of the triangle with a surge in late May. The breakout zone around 72 turns into first support and this area is holding (blue zone).
While a move back below the breakout zone would be a mild negative, it would not be enough to derail the bigger uptrend. The stock established support in the 67-68 area with at least three bounces and this level defines the bigger uptrend. A close below 67 would call for a re-evaluation.
The indicator window shows RSI moving above 70 in late January and holding mostly in its bull range (40-80). RSI dipped to 37 in late March, but quickly recovered to maintain the bull range. It is also noteworthy that RSI did not dip below 40 in May as the stock held up well.
On Trend on YouTube (Tuesday, June 4th)
- Charting with StockChartsACP
- S&P 500 Toys with 200-day
- Parade of Negative Charts (XRT, SPHB...)
- A Few ETFs Held Up in May (VNM, FM)
- Stocks: INCY, HXL, ROLL, TDY, HON
- Click here to Watch
Arthur Hill, CMT
Senior Technical Analyst, StockCharts.com
Author, Define the Trend and Trade the Trend
Want to stay up to date with the latest market insights from Arthur?
– Follow @ArthurHill on Twitter
– Subscribe to Art's Charts
– Watch On Trend on StockCharts TV (Tuesdays / Thursdays at 10:30am ET)


