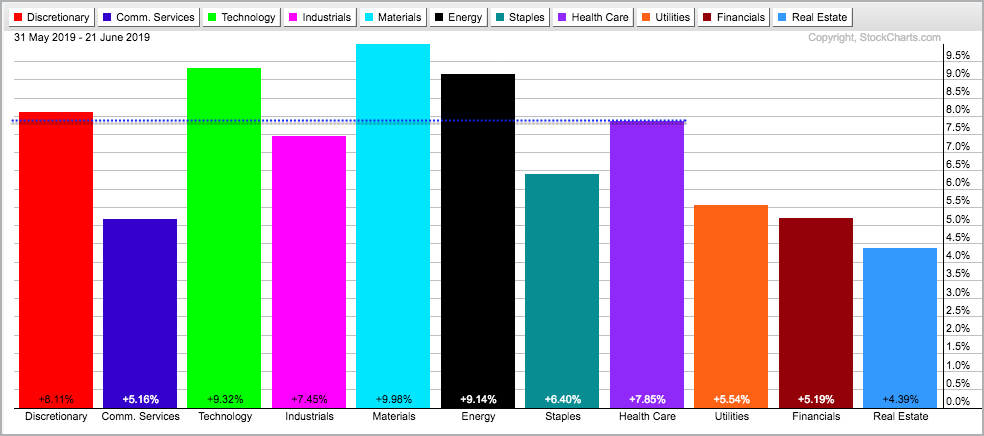
The S&P 500 hit a new high last week and the Health Care SPDR (XLV) broke out of a large symmetrical triangle with a big surge in June. The stock market is in bull mode and healthcare is coming alive. XLV was the worst performing sector from January to May (+1.27%), but turned around in June and is one of the top performing sectors (+7.85%). Also note that healthcare is the third largest sector (14.3%) in the S&P 500. Thus, strength in healthcare contributes to strength in the S&P 500.
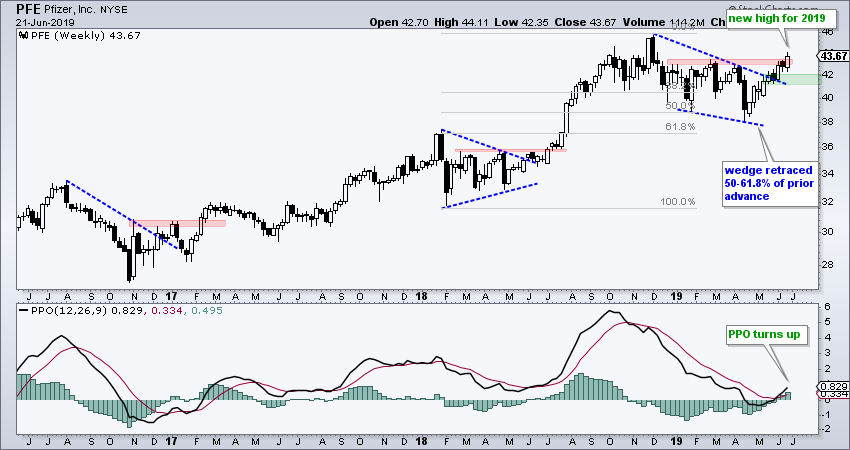
On the price chart, PFE broke out of a large falling wedge with a big advance over the last nine weeks. Notice that this wedge retraced 50-61.8% of the prior decline. Thus, the 2018 advance looks like two steps forward and the falling wedge looks like one step backward. The recent breakout indicates that the correction has ended and the bigger uptrend is resuming. As such, I would expect new highs in the coming weeks or months.
The indicator window shows the Percentage Price Oscillator (PPO) dipping into negative territory in April and then turning up over the last few weeks. The PPO moved back into positive territory and back above its signal line. A positive PPO means the 12-week EMA is above the 26-week EMA and a PPO above its signal line means momentum is bullish.
Chartists looking for a pullback opportunity can watch the 41-42 area for first support. The stock is a little over extended after a double digit rise the last nine weeks. A little dip into this zone may be the short-term pause that refreshes.
On Trend on YouTube (Thursday, June 20th)
- Long-Short Review (SPY, QQQ, IWM)
- $SPX does not Care about Utes, Reits, Staples and Bonds
- Revisiting Chinese and Semiconctor ETFs
- Semiconductor and Software Stock Setups
- Stocks to Watch: FISV, PPL, AME, FAST
- Click here to Watch
Arthur Hill, CMT
Senior Technical Analyst, StockCharts.com
Author, Define the Trend and Trade the Trend
Want to stay up to date with the latest market insights from Arthur?
– Follow @ArthurHill on Twitter
– Subscribe to Art's Charts
– Watch On Trend on StockCharts TV (Tuesdays / Thursdays at 10:30am ET)


