
Relative Rotation Graphs can be used to visualize the relative movement of much more than just stocks and sectors.
In the example below, the RRG shows the relative rotation for the G10 currency universe using USD as the base currency. In this case, you will see nine currencies, all expressed in USD terms, rotating around the USD.
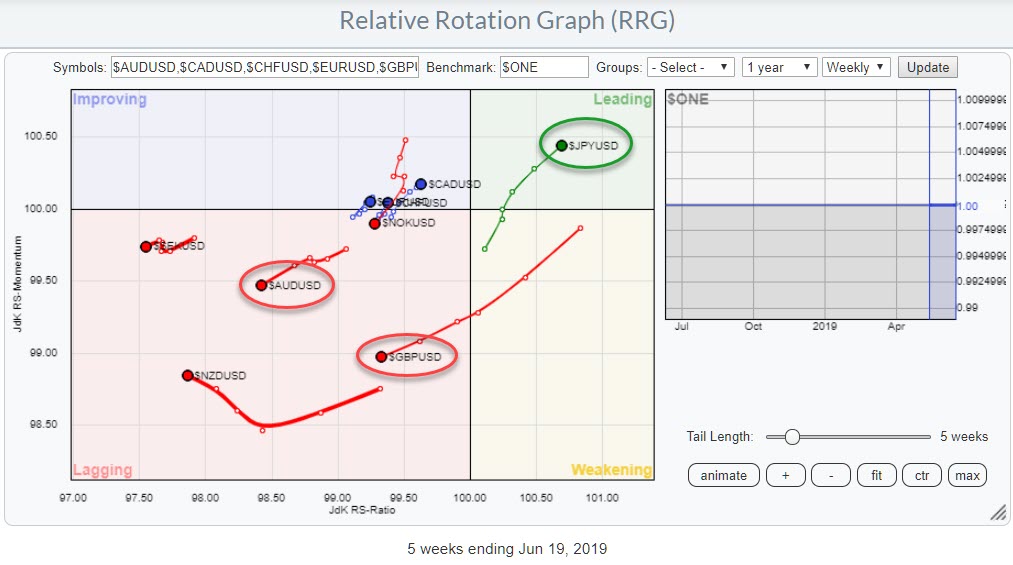
Because currency pairs in and of themselves are already relative strength lines, we need to set the "Benchmark" for this RRG to $ONE.
Looking at the chart, we can easily see that the USD, which is the center of the graph (at the crosshairs), is stronger than most of the other currencies in this universe. (Eight out of nine, to be precise.) All these eight currencies are on the left-hand side of the RRG, which means that their trends against the USD are down. This is a weekly RRG, so we are looking at longer-term trends.
The lone exception to this pattern is the Japanese Yen, which shows up inside the leading quadrant and is at a strong RRG-Heading, pushing further into positive territory.
$JPYUSD
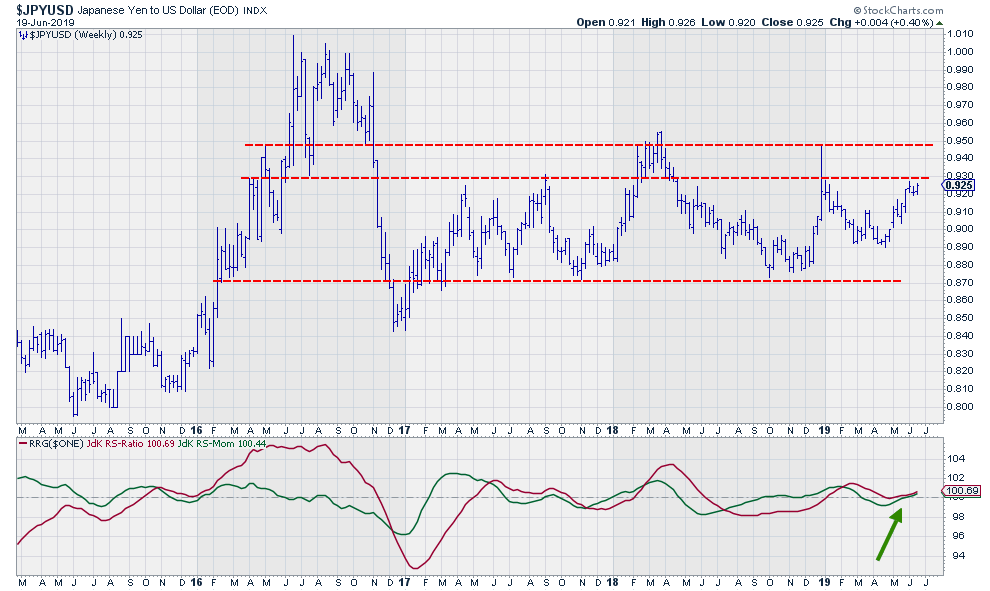
Pulling up the price chart for $JPYUSD* shows that this pair has been trading in a range between $0.87 - $0.93 since the start of 2017. The dashed support and resistance levels marking the boundaries of this range also touched a few important highs and lows back in 2016, making them significant levels.
At the moment, $JPYUSD is pushing against the barrier near $0.93 while both RRG-Lines are pointing higher, suggesting that more strength is available for the Yen versus the Dollar. A break beyond $0.93 will confirm this strength. After that, the next level to watch is $0.95.
For the time being, the Japanese Yen seems to be on a path toward further strengthening against the US Dollar.
*The "market convention" when referring to the Japanese Yen is USD/JPY, Dollars expressed in Yen. For the RRG to show the correct rotations, we need to bring all currencies to the same denominator, in this case, the USD. Hence why we have JPY/USD. To keep things aligned, I am also using JPY/USD in the price graph.
My regular blog is the RRG Charts blog. If you would like to receive a notification when a new article is published there, simply "Subscribe" with your email address.
Julius de Kempenaer
Senior Technical Analyst, StockCharts.com
Creator, Relative Rotation Graphs
Founder, RRG Research
Want to stay up to date with the latest market insights from Julius?
– Follow @RRGResearch on Twitter
– Like RRG Research on Facebook
– Follow RRG Research on LinkedIn
– Subscribe to the RRG Charts blog on StockCharts
Feedback, comments or questions are welcome at Juliusdk@stockcharts.com. I cannot promise to respond to each and every message, but I will certainly read them and, where reasonably possible, use the feedback and comments or answer questions.
To discuss RRG with me on S.C.A.N., tag me using the handle Julius_RRG.
RRG, Relative Rotation Graphs, JdK RS-Ratio, and JdK RS-Momentum are registered trademarks of RRG Research.


