When I opened up the Relative Rotation Graph for US sectors (weekly version), the position and the current rotation for the Technology sector caught my attention.
If you are a regular reader of articles you will know that my default time frame is weekly. On that weekly RRG, XLK is positioned inside the weakening quadrant and is the highest ranking sector on the RS-Ratio scale. But what is the most interesting is that the tail has started to curl back up again, pointing towards the leading quadrant. These are usually bullish (relative) rotations as they signal the start of a second (or third, etc.) leg of an already rising relative trend.
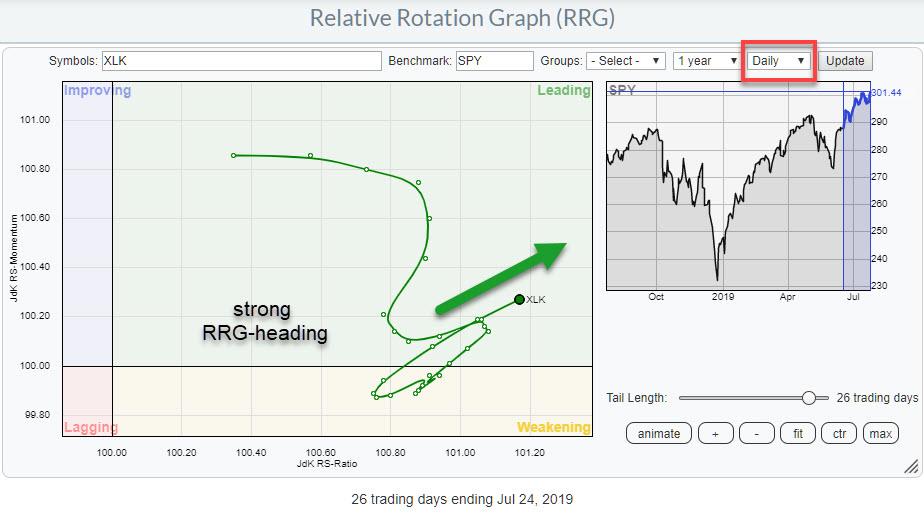
Shifting from Weekly to Daily
Next, I shifted from the weekly RRG to the daily, resulting in the chart at the top of the article.
The rotation here fully backs up the development that we see on the weekly RRG. The tail for XLK rotated from leading into weakening for a short period of time, then started accelerating back into the leading quadrant.
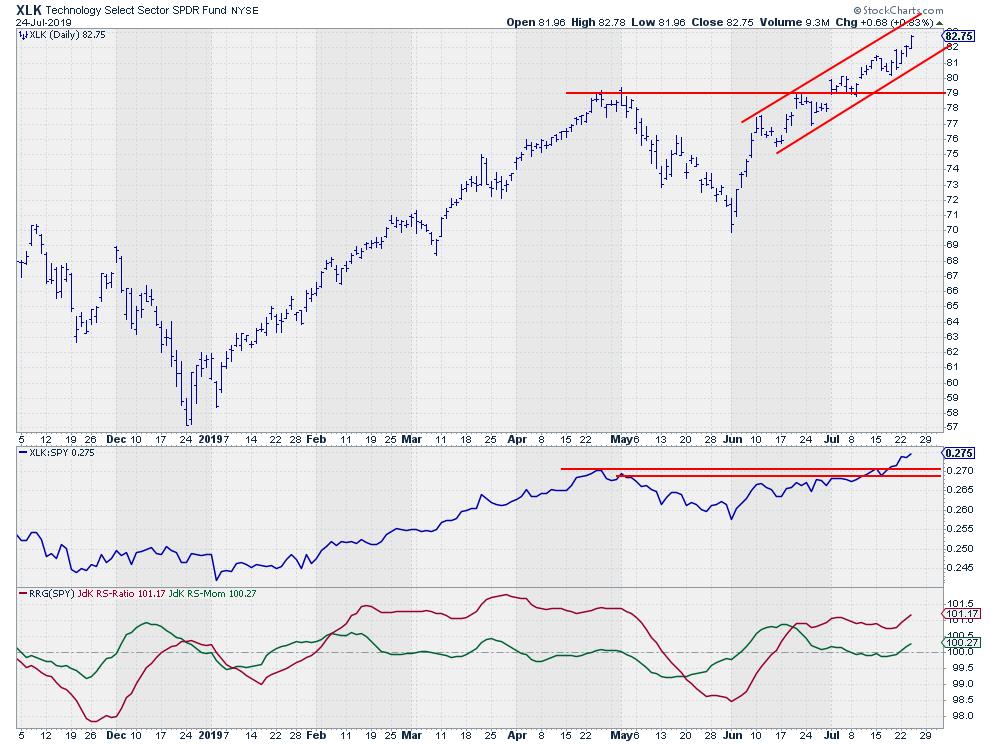
These developments are also clearly seen on the price chart for XLK in combination with Relative Strength and RRG-Lines. The RS-Lines just broke to new highs after a short sideways move, unlocking new relative upside potential. The RRG-Lines put XLK into the leading quadrant in mid-June, when the JdK RS-Ratio line followed RS-Momentum above 100. The RS-Ratio line managed to hold up around 101, when RS-Momentum dipped below 100 for a brief period (causing the rotation through weakening on the RRG).
With the current rise of RS-Momentum back above 100, XLK is now back inside the leading quadrant and Relative Strength is firing on all cylinders!
My regular blog is the RRG Charts blog. If you would like to receive a notification when a new article is published there, simply "Subscribe" with your email address.
Julius de Kempenaer
Senior Technical Analyst, StockCharts.com
Creator, Relative Rotation Graphs
Founder, RRG Research
Want to stay up to date with the latest market insights from Julius?
– Follow @RRGResearch on Twitter
– Like RRG Research on Facebook
– Follow RRG Research on LinkedIn
– Subscribe to the RRG Charts blog on StockCharts
Feedback, comments or questions are welcome at Juliusdk@stockcharts.com. I cannot promise to respond to each and every message, but I will certainly read them and, where reasonably possible, use the feedback and comments or answer questions.
To discuss RRG with me on S.C.A.N., tag me using the handle Julius_RRG.
RRG, Relative Rotation Graphs, JdK RS-Ratio, and JdK RS-Momentum are registered trademarks of RRG Research.
Julius de Kempenaer
Senior Technical Analyst, StockCharts.com
Creator, Relative Rotation Graphs
Founder, RRG Research
Host of: Sector Spotlight
Please find my handles for social media channels under the Bio below.
Feedback, comments or questions are welcome at Juliusdk@stockcharts.com. I cannot promise to respond to each and every message, but I will certainly read them and, where reasonably possible, use the feedback and comments or answer questions.
To discuss RRG with me on S.C.A.N., tag me using the handle Julius_RRG.
RRG, Relative Rotation Graphs, JdK RS-Ratio, and JdK RS-Momentum are registered trademarks of RRG Research.


