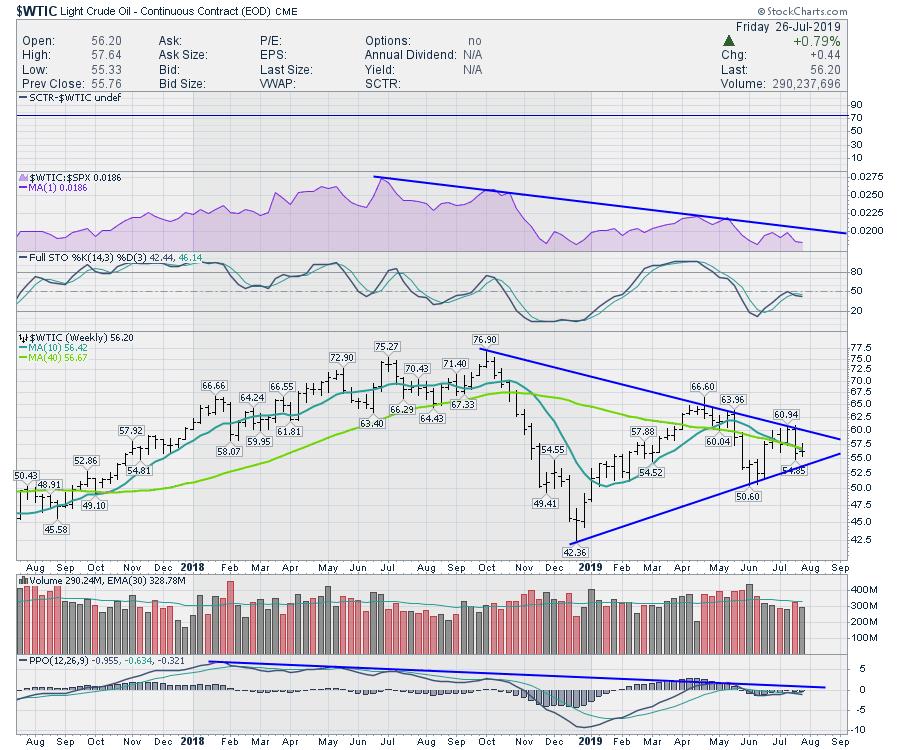
Crude Oil ($WTIC) continues to be a focal point for the world. With diminishing demand and a lack of investment in the mega-projects of the future, the mystery of oil continues. However, lots of current production, along with an OPEC organization trying to stabilize the price, add to the mix. Short-term, the price is difficult to fund big projects. With the downtrend in crude oil pricing, the pennant is tightening on price. Crude Oil is now getting very close to a breakout or breakdown, high or low.
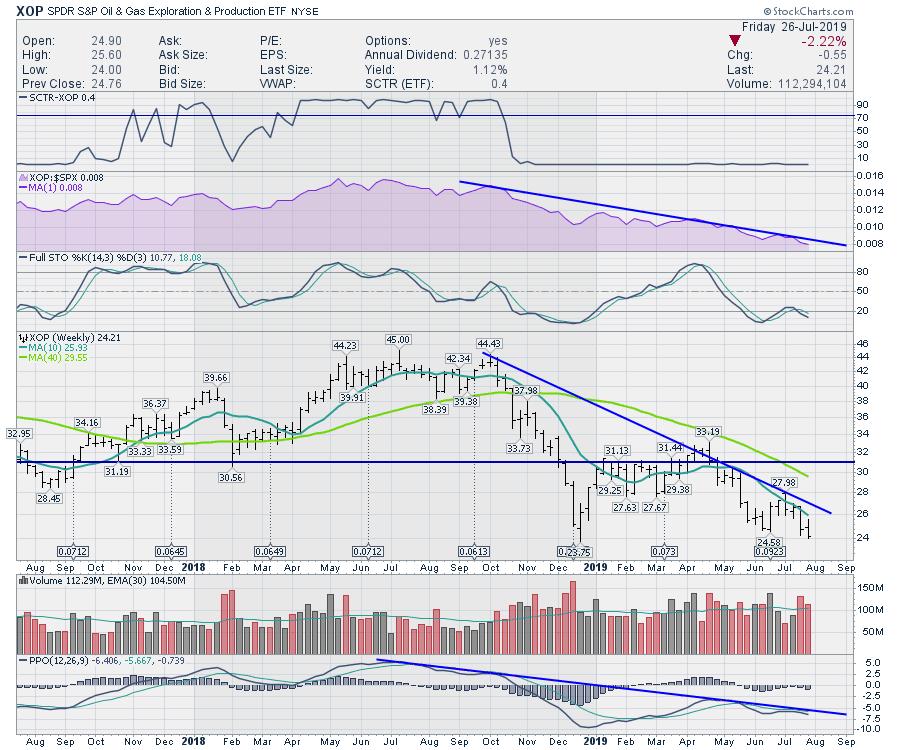
With all the bullishness out there, the energy stocks couldn't be more removed from the excitement. Using XOP, the exploration and production ETF, we can see the chart is significantly weaker than the crude oil chart. XOP is currently testing the 2019 lows. An optimist would say that, because it's at support, it should bounce now; a pessimist would say the next weeks will bring lower lows.
Because energy is at support, it might be time to start looking at some names in that space. Natural gas is near major lows, crude oil has fallen significantly and the oil companies are sitting near support.
Interestingly, this setup on the full stochastic is one of George Lane's favorite setups. Price has made a lower low compared to the June low, but the stochastic looks like it is attempting to make a double bottom.
Until we see at least a price bar with a higher low and a higher high, this is an area to watch only. But a positive turn on the full stochastic above the signal line and a break in the downward momentum on the PPO would be a nice place to look for a trade into the fall season. That looks like a good reason to watch this chart closely.
Good trading,
Greg Schnell, CMT, MFTA
Senior Technical Analyst, StockCharts.com
Author, Stock Charts For Dummies
Want to stay on top of the market's latest intermarket signals?
– Follow @SchnellInvestor on Twitter
– Connect with Greg on LinkedIn
– Subscribe to The Canadian Technician
– Email at info@gregschnell.com
