After an extended tightening cycle, the Fed is set to lower rates for the first time since December 2008 (yawn). It seems easy to equate easier Fed policy as bullish for housing, but the relationship between Treasury yields and the Home Construction iShares (ITB) is not as clear cut. First and foremost, keep in mind that the Fed is almost always behind the curve. As the chart below shows the 10-yr T-Yield peaked in November 2018 and has been falling for over six months. The Fed is simply reacting to the bond market, which usually leads the Fed.
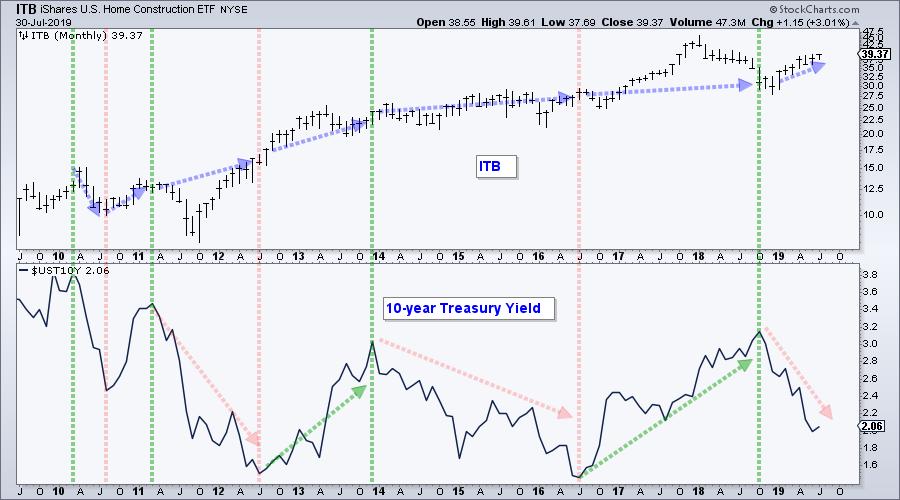
The chart above highlights ITB and some big swings in the 10-yr T-Yield over the last ten years. I don't know about you, but I do not see a consistent and clear-cut relationship between the two. As far as I am concerned, we need to analyze ITB if we are interested in ITB. There are a zillion things affecting housing and the ETF price. We cannot possibly know them all so it is best to simply study price action for ITB. Forget the narratives and study the chart!
The chart below shows ITB in a clear uptrend and with a bullish continuation pattern taking shape. We do not need moving averages or lines to figure out that prices are moving from the lower left to the upper right (uptrend). The ETF consolidated with an ascending triangle the last two months and challenged the June-July highs with a surge on Tuesday. The higher lows of the pattern show buying pressure coming in at higher levels. The equal highs mark the supply line. A break above this supply line would show an increase in demand and confirm the pattern.
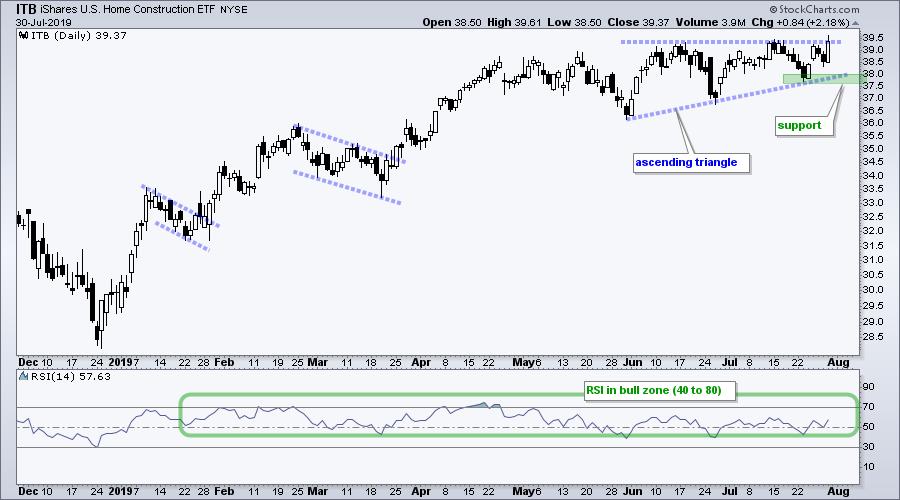
The indicator window shows RSI trading in its bull range this year (40 to 80). Momentum dips were contained as RSI found support in the 40-50 area and bounced. Going forward, I would watch two things for signs of failure. First, a support break at 37.5 would negate the ascending triangle. Second, an RSI break below 40 would show the most downside momentum since late December.
Follow me on twitter: @arthurhill
Email comments: arthurh@stockcharts.com
--------------------------------------------------------------------
Choose a Strategy, Develop a Plan and Follow a Process
Arthur Hill, CMT
Chief Technical Strategist, TrendInvestorPro.com
Author, Define the Trend and Trade the Trend
Want to stay up to date with Arthur's latest market insights?
– Follow @ArthurHill on Twitter


