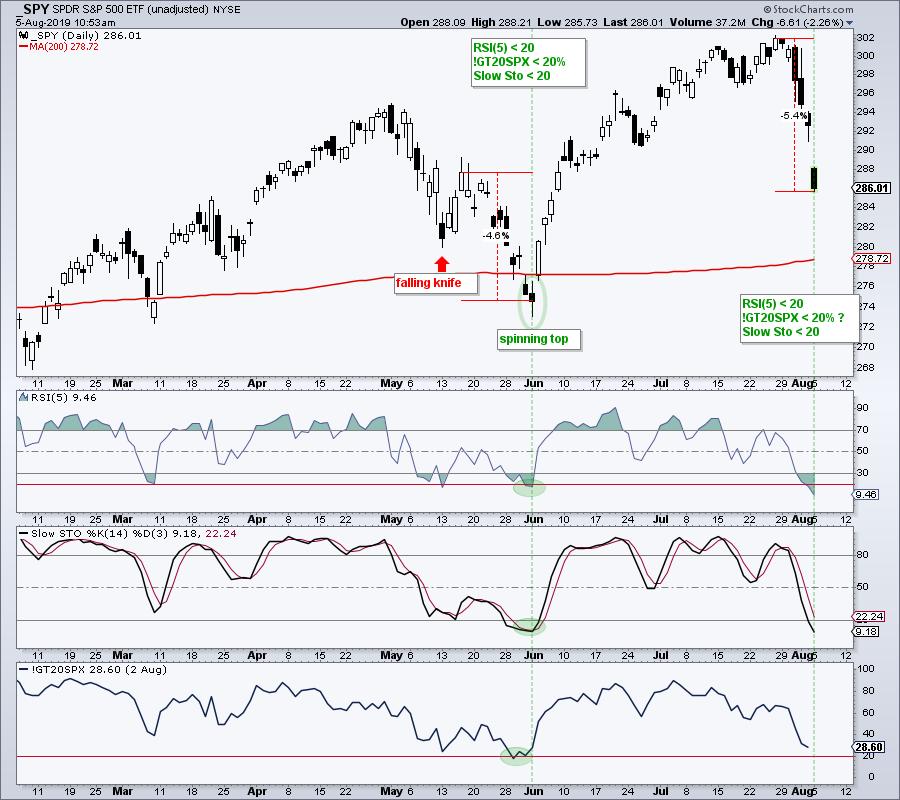
The S&P 500 SPDR (SPY) is down sharply this morning and over the last six days. The ETF hit a new all time high less than two weeks ago and remains above its 200-day SMA, and its early June low. This suggests that the long-term trend remains up. Moreover, three indicators point to oversold conditions that could give way to a bounce.
The chart shows SPY falling around 5% the last six days. While we do not need any indicators to tell us the ETF is short-term oversold, I will show three to quantify conditions. The first indicator window shows RSI(5) moving below 20 for the first time since early June. The second window shows the Stochastic Oscillator (14,3) moving below 20 for the first time since early June.

The third indicator window shows S&P 500 %Above 20-day EMA (!GT20SPX) moving below 30% on Friday. This indicator will likely move below 20% if the market maintains its losses into the close today. %Above 20-day EMA was last below 20% in late May (green oval). This means we could see all three indicators in oversold territory by the close and this could pave the way for at least an oversold bounce.
At this point, playing for an oversold bounce is like catching a falling knife, kind of like on May 13th (red arrow). In addition, we have yet to see any signs of firmness with an indecisive candlestick. Notice that a spinning top formed on June 3rd and SPY gapped up the next day. Traders looking to catch an oversold bounce need to be nimble and have an exit strategy.
----------------------------------------
Choose a Strategy, Develop a Plan and Follow a Process
Arthur Hill, CMT
Chief Technical Strategist, TrendInvestorPro.com
Author, Define the Trend and Trade the Trend
Want to stay up to date with Arthur's latest market insights?
– Follow @ArthurHill on Twitter


