 RRG of International Equity markets vs. DJ Global Index
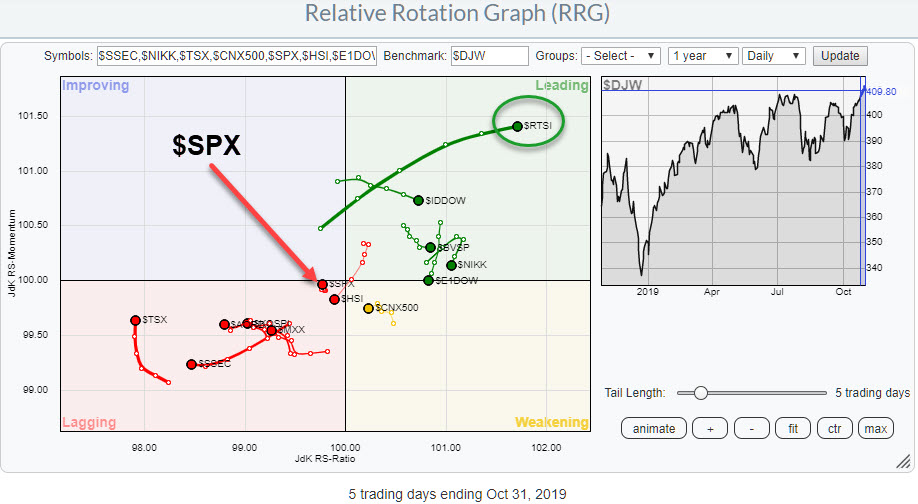
Despite the S&P 500 making new highs and looking strong on the charts, it is definitely not the strongest market in the world at the moment...
The RRG above shows the daily rotation for a universe of major stock market indexes around the world. The S&P is currently found just inside the lagging quadrant with a very short tail. Over the last five trading days, it has barely moved.
This is contrast to some of the other markets, especially Russia. The $RTSI index is powering into the leading quadrant at a strong heading and is backed by a long tail. That's more than enough reason to inspect the price chart for this market.
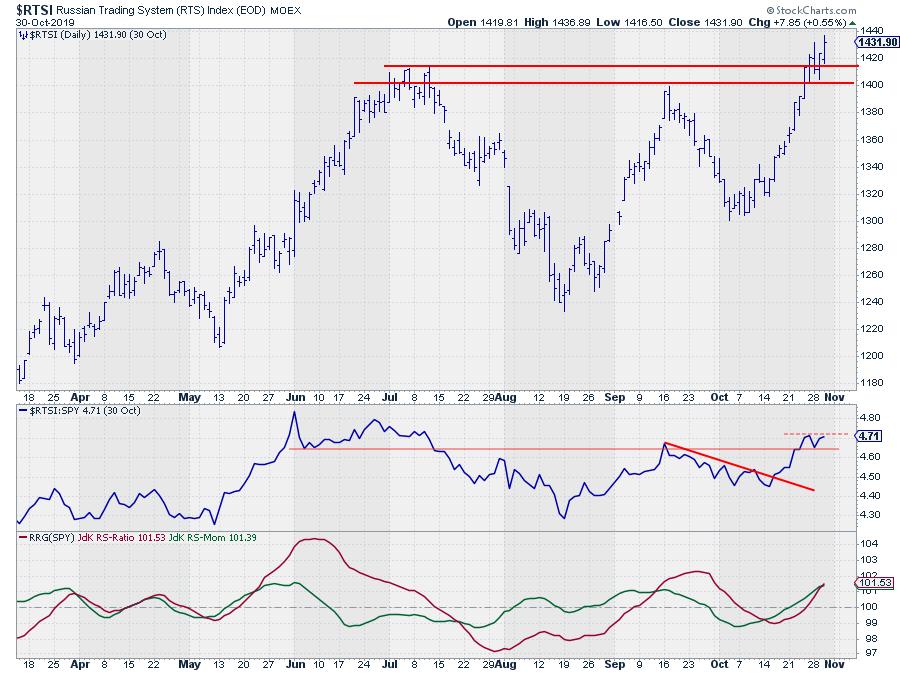 Russian $RTSI daily chart with relative strength and RRG-Lines vs. DJ Global index
The improvement since the start of October, when the $RTSI Index put in a new higher low, is clearly visible. The rally out of that low is now breaking overhead resistance between 1400-1415 and looks ready to continue higher in coming weeks.
The relative strength line is in the process of breaking its overhead resistance. When that break holds, $RTSI will have more relative upside potential vs. the rest of the world available. The RRG-Lines are picking up this improvement and are now both above the 100 level and rising.
The weekly RRG shows the Russian index crossing back into the leading quadrant from a rotation through weakening. This is a strong rotation that is now backed by the strength on the daily RRG.
With regard to the break in price, while there is no reference point on the chart (as printed above), it is always good (and necessary) to check the longer-term picture to see if we're not just below some major overhead resistance level.
The monthly chart of the $RTSI shows that that is not the case and that we are in fact breaking above the 2014 high, which was lining up with the most recent high in 2019.
I don't think that this 2014 high represents a major resistance level, as it is one of the many intermediate highs that was formed during the downtrend from 2011 down to the lows in 2015 and 2016. That said, it IS a break and it IS taking away some of the overhead supply.
All in all, I expect the positive rotation for this market to continue, resulting in a further outperformance going forward.
-Julius
My regular blog is the RRG Charts blog. If you would like to receive a notification when a new article is published there, simply "Subscribe" with your email address.
Julius de Kempenaer
Senior Technical Analyst, StockCharts.com
Creator, Relative Rotation Graphs
Founder, RRG Research
Want to stay up to date with the latest market insights from Julius?
– Follow @RRGResearch on Twitter
– Like RRG Research on Facebook
– Follow RRG Research on LinkedIn
– Subscribe to the RRG Charts blog on StockCharts
Feedback, comments or questions are welcome at Juliusdk@stockcharts.com. I cannot promise to respond to each and every message, but I will certainly read them and, where reasonably possible, use the feedback and comments or answer questions.
To discuss RRG with me on S.C.A.N., tag me using the handle Julius_RRG.
RRG, Relative Rotation Graphs, JdK RS-Ratio, and JdK RS-Momentum are registered trademarks of RRG Research.
Julius de Kempenaer
Senior Technical Analyst, StockCharts.com
Creator, Relative Rotation Graphs
Founder, RRG Research
Host of: Sector Spotlight
Please find my handles for social media channels under the Bio below.
Feedback, comments or questions are welcome at Juliusdk@stockcharts.com. I cannot promise to respond to each and every message, but I will certainly read them and, where reasonably possible, use the feedback and comments or answer questions.
To discuss RRG with me on S.C.A.N., tag me using the handle Julius_RRG.
RRG, Relative Rotation Graphs, JdK RS-Ratio, and JdK RS-Momentum are registered trademarks of RRG Research.


