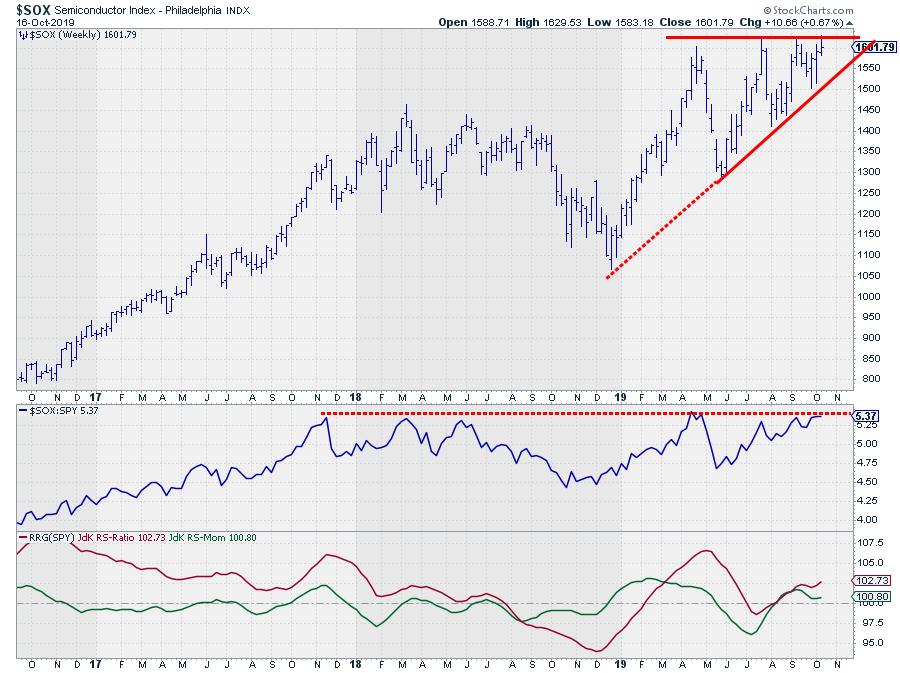
In the past week or so, I've seen a few headlines flying by mentioning the semiconductor index ($SOX) and an alleged breakout. In response, I checked out the chart of $SOX, as printed above, in combination with relative strength versus SPY.
What I see is a pretty big ascending triangle in the making. If (and only if) that formation resolves to the upside a strong buy signal for semis will be triggered. However, we are not there yet, IMHO. For the time being, $SOX is battling resistance around 1625.
A similar situation is visible in the raw RS line, which is pushing against its overhead resistance level (horizontal). Here too, a break of that barrier would trigger further improvement for semiconductors against the S&P 500.
The RRG Lines seem to be anticipating a break higher, which is encouraging, but the real trigger will have to come from the price chart.
The next thing I did was to throw all semiconductor stocks from the Technology Index on a Relative Rotation Graph in order to get a better handle on individual stocks' rotations within this group.
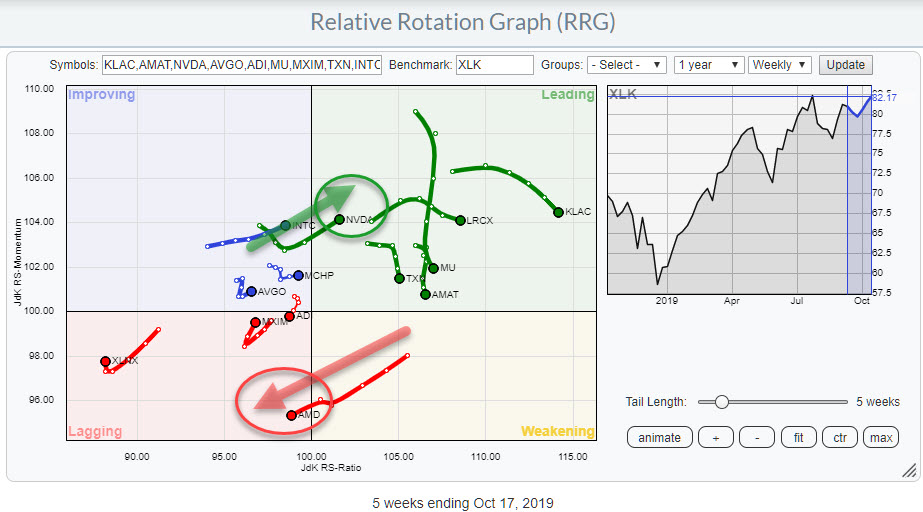 What I noticed on this RRG chart is the opposite rotation of two important members of this group. AMD pushed into the lagging quadrant from weakening, while NVDA picked up relative momentum again and has moved into leading from improving. When stocks show opposing rotations, that is always worth a further investigation in a potential pair-trading opportunity.
In order to zoom in on this relationship, I drew the chart of NVDA, using AMD as the "benchmark" to isolate the pair.
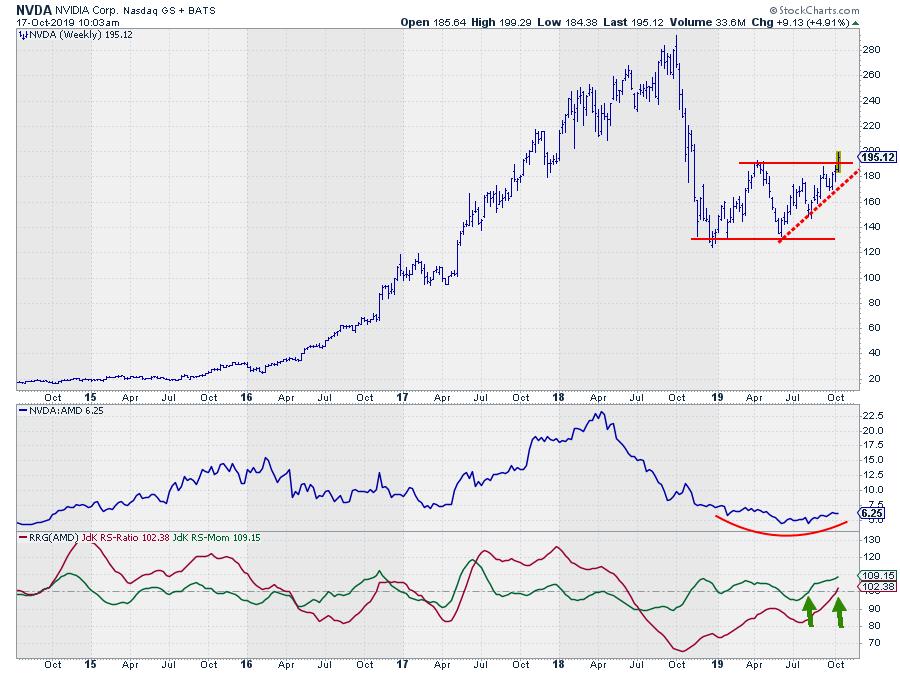
Although not even close to breaking to new all-time-highs, NVDA seems to be completing an important bottom formation that could be labelled as a big double-bottom formation. The break above its April high is definitely a bullish sign.
The relative strength vs. its peer AMD has been bearish since April 2018 and started to level off at a lower level in 2019. The RRG-Lines are now picking up the first signs of a trend reversal for this pair.
Ultimately, within the semiconductor index, NVDA is expected to outperform AMD during the coming weeks.
-Julius
My regular blog is the RRG Charts blog. If you would like to receive a notification when a new article is published there, simply "Subscribe" with your email address.
Julius de Kempenaer
Senior Technical Analyst, StockCharts.com
Creator, Relative Rotation Graphs
Founder, RRG Research
Want to stay up to date with the latest market insights from Julius?
– Follow @RRGResearch on Twitter
– Like RRG Research on Facebook
– Follow RRG Research on LinkedIn
– Subscribe to the RRG Charts blog on StockCharts
Feedback, comments or questions are welcome at Juliusdk@stockcharts.com. I cannot promise to respond to each and every message, but I will certainly read them and, where reasonably possible, use the feedback and comments or answer questions.
To discuss RRG with me on S.C.A.N., tag me using the handle Julius_RRG.
RRG, Relative Rotation Graphs, JdK RS-Ratio, and JdK RS-Momentum are registered trademarks of RRG Research.
Julius de Kempenaer
Senior Technical Analyst, StockCharts.com
Creator, Relative Rotation Graphs
Founder, RRG Research
Host of: Sector Spotlight
Please find my handles for social media channels under the Bio below.
Feedback, comments or questions are welcome at Juliusdk@stockcharts.com. I cannot promise to respond to each and every message, but I will certainly read them and, where reasonably possible, use the feedback and comments or answer questions.
To discuss RRG with me on S.C.A.N., tag me using the handle Julius_RRG.
RRG, Relative Rotation Graphs, JdK RS-Ratio, and JdK RS-Momentum are registered trademarks of RRG Research.


