Relative Rotation Graphs are perfectly suited for finding pair trade opportunities. In this week's episode of Sector Spotlight (November 19th), I showed one way to find a possible pair-trading opportunity.
Wanting to find a sector with high (or the highest) upward potential and the sector with high (or the highest) risk, I used the RRG for US sectors to identify the Technology sector as strong and still showing potential. The sector had just rotated back into the leading quadrant from weakening; this signaled a new leg in its already rising relative trend.
On the opposite side, meanwhile, I judged the Energy sector as high risk, as it started to turn down again while inside the improving quadrant and is still very low on the JdK RS-Ratio scale.
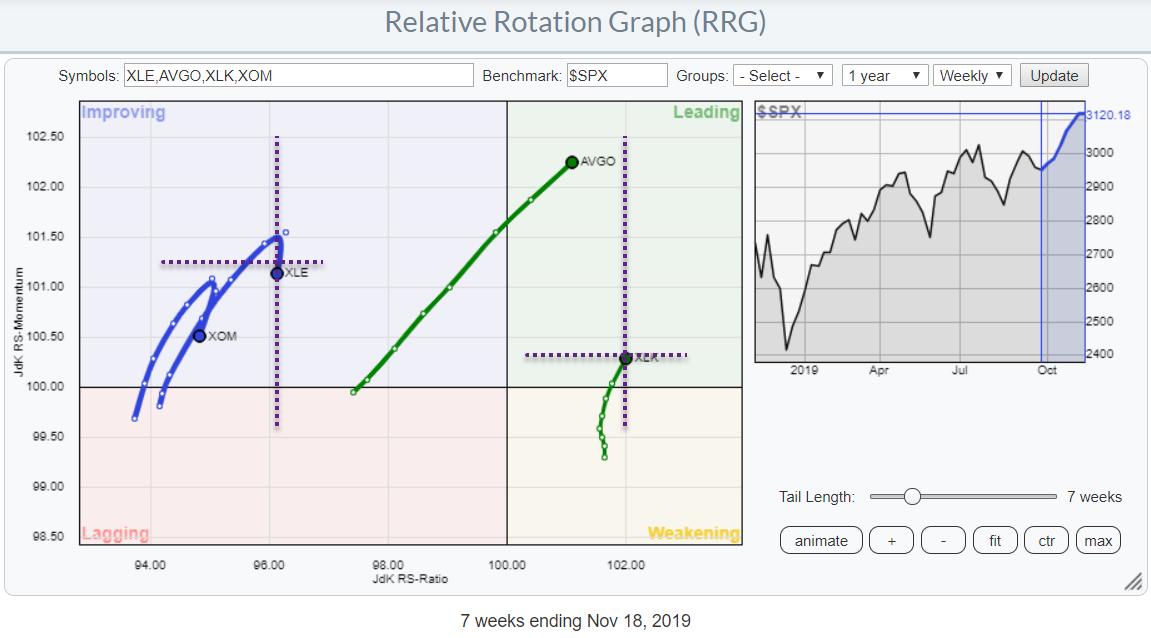
The next step was to find a strong, high potential stock inside Technology and a weak, high-risk stock inside Energy. Using the RRGs (from the dropdown menu) showing the members of each sector, I found Broadcom (AVGO) in Technology as potentially strong, as it has just entered the leading quadrant at a strong RRG-Heading and an expanding tail. Meanwhile, in Energy, Exxon Mobil (XOM) showed up as weak because it just turned around back into the lagging quadrant.
The RRG chart at the top of this article shows the two sectors and the two stocks on one RRG vs. SPY. By virtually overlaying the crosshairs (JdK RS-Ratio and JdK RS-Momentum axes) on the sectors, you can see where the stocks are rotating vs. their sectors as well.
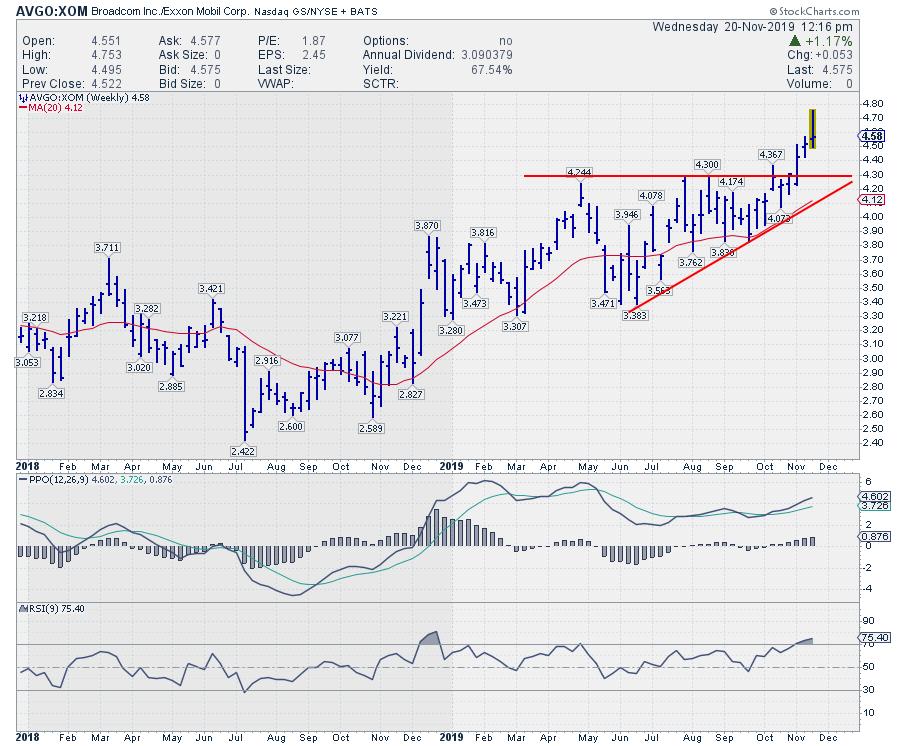
 AVGO vs XOM, weekly chart
The chart above shows the relative strength of AVGO vs. XOM on a weekly bar chart. The upward breakout of the ascending triangle supports a further overperformance for AVGO over XOM, with the former horizontal resistance now acting as support in case of declines.
Depending on how aggressive you want to be, I would say stops need to go somewhere between 4.00 and 4.20 on a Friday close.
-Julius
My regular blog is the RRG Charts blog. If you would like to receive a notification when a new article is published there, simply "Subscribe" with your email address.
Julius de Kempenaer
Senior Technical Analyst, StockCharts.com
Creator, Relative Rotation Graphs
Founder, RRG Research
Want to stay up to date with the latest market insights from Julius?
– Follow @RRGResearch on Twitter
– Like RRG Research on Facebook
– Follow RRG Research on LinkedIn
– Subscribe to the RRG Charts blog on StockCharts
Feedback, comments or questions are welcome at Juliusdk@stockcharts.com. I cannot promise to respond to each and every message, but I will certainly read them and, where reasonably possible, use the feedback and comments or answer questions.
To discuss RRG with me on S.C.A.N., tag me using the handle Julius_RRG.
RRG, Relative Rotation Graphs, JdK RS-Ratio, and JdK RS-Momentum are registered trademarks of RRG Research.
Julius de Kempenaer
Senior Technical Analyst, StockCharts.com
Creator, Relative Rotation Graphs
Founder, RRG Research
Host of: Sector Spotlight
Please find my handles for social media channels under the Bio below.
Feedback, comments or questions are welcome at Juliusdk@stockcharts.com. I cannot promise to respond to each and every message, but I will certainly read them and, where reasonably possible, use the feedback and comments or answer questions.
To discuss RRG with me on S.C.A.N., tag me using the handle Julius_RRG.
RRG, Relative Rotation Graphs, JdK RS-Ratio, and JdK RS-Momentum are registered trademarks of RRG Research.


