Today's sharp midday selloff on negative trade news was a stark reminder that market conditions can change on a dime. It's also a reminder that you need to have an exit strategy in place should a pullback turn into a correction or worse.
Below is a daily price chart of Apple (AAPL), which has been in a confirmed uptrend since early October following the stock's breakout from a 3-week base. The solid double-digit advance since then has been great news for those who own the stock, but let's review what to be on the lookout for so you'll know when the near-term uptrend is over.
DAILY CHART OF APPLE (AAPL)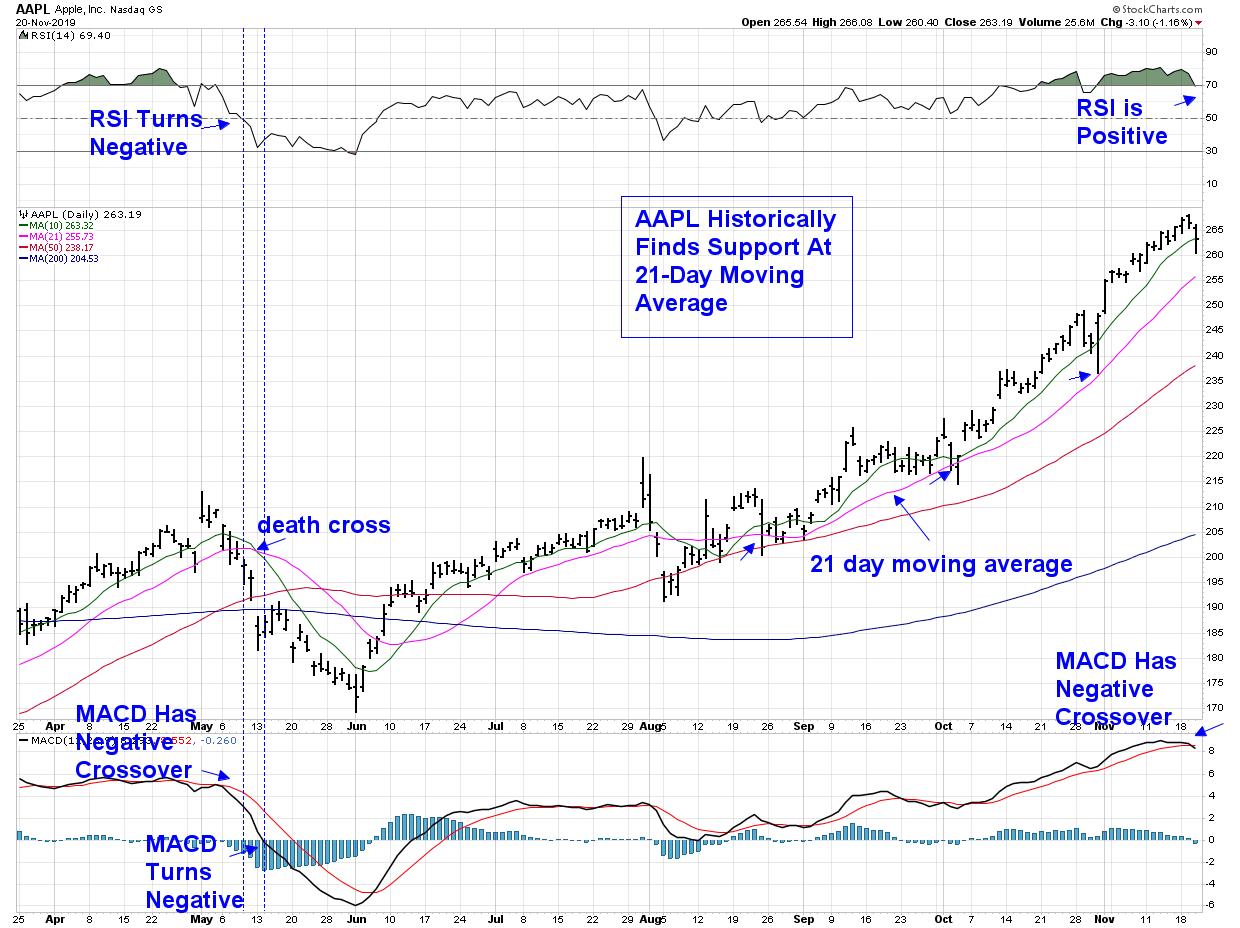
Using history as your guide, you'll see that, in recent times, Apple generally pulls back to its 21-day moving average where it finds support. Using more history as our guide, let's focus on the uptrend reversal that occurred in early May as your negative signal guide.
Using the farthest-left dashed vertical line, notice that the stock broke below its normally supportive 21-day moving average. While that's not a sell signal on its own, you'll see that the RSI turned negative simultaneously, so it's at least a red flag. You also had a MACD that was above neutral; however, a negative crossover with the black line crossing below the red signal line had occurred.
Moving to just prior to the second dashed vertical line, you get much clearer negative signals as AAPL breaks below its 50-day moving average and the MACD breaks below zero. In addition, a death cross was created when the shorter term 10 day moving average broke below the longer term 21-day moving average. By this point, you'll want to exit the stock.
While Apple (AAPL) was able to quickly recover, oftentimes a stock will begin a prolonged descent following the occurrence of the negative signals shown in that early May period. Just take a look at the many growth stocks that peaked in late July and you'll see these signals playing out again and again.
While most stock market newsletters will tell you when to get into a stock, the MEM Edge Report that I produce guides you further and tells you when to exit so that you can preserve your profits while learning the signals. You can use this link to take a 4-week trial at a nominal fee. Subscribers back in October were alerted to Apple's breakout along with many other winning trades.
For those who'd like to receive a free weekly newsletter that'll outline the upcoming Market Vision 2020 virtual conference that's coming up, please use this link here to sign up. There will be lots of valuable market insights and big giveaways, so you won't want to miss out!! Many of your favorite StockCharts.com commentators will be participating, so get on the Early Bird List here.
Warmly,
Mary Ellen McGonagle,