 AMD weekly chart with relative strength and RRG - Lines
When I ran the RRG for the most active movers in the S&P 500 (at yesterday's close), I noted a strong rotation for AMD.
This stock entered the leading quadrant in the week of 18 March and moved inside that quadrant until the week of June 24, picking up 30% (vs S&P 4.2%). From 24 June onwards, AMD rotated through the weakening quadrant, curling back up just before its tail would hit lagging.
Over the last three weeks, relative momentum has picked up for AMD and is now close to re-entering the leading quadrant, very likely starting a new up-leg in its relative uptrend.
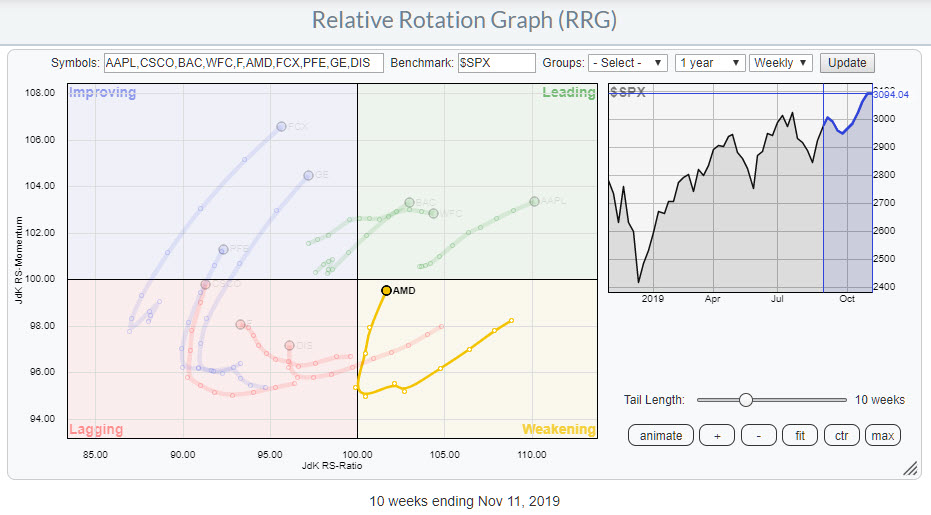 Weekly RRG of Most active stocks in S&P 500 (11/14)
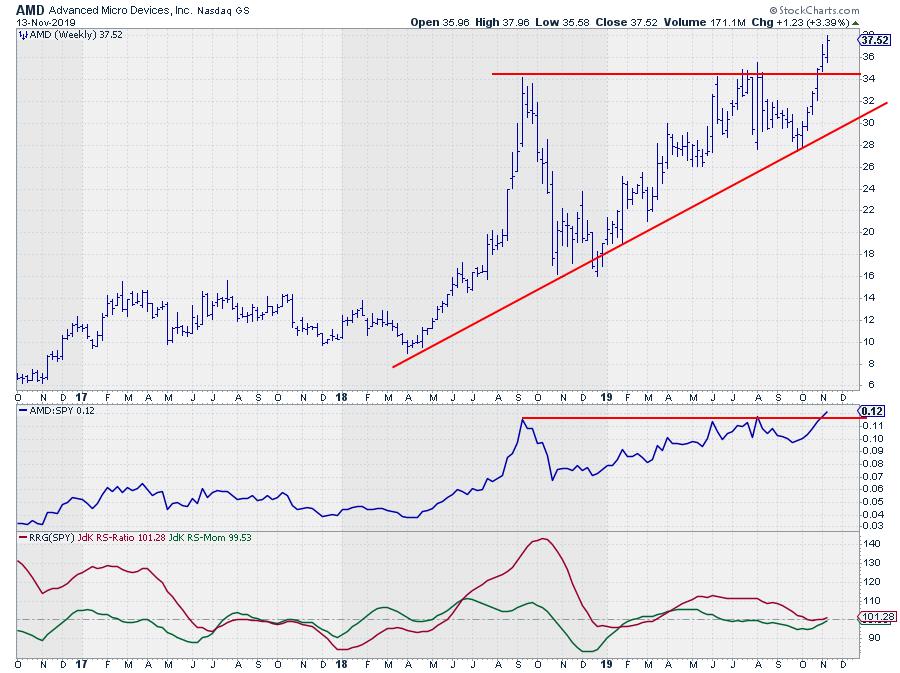
Bringing that rotation back to a regular time/price based chart gives the picture printed at the top of this article.
The recent break above horizontal resistance in price, as well as in relative strength, supports a further rise in AMD.
But... be careful. This image does not tell the whole story. AMD is one of the tech stocks that is NOT pushing to new all-time highs. So, for us to get the complete picture, we should also inspect the longer-term chart.
This chart reveals that there are two major former peaks that are likely to come into play as resistance - one around $ 42.70 (2006) and the other one at $ 48.50 (2000). Nevertheless, that first level is still almost 14% from current levels while the downside is well-protected (stops?) near $34.50.
-Julius
My regular blog is the RRG Charts blog. If you would like to receive a notification when a new article is published there, simply "Subscribe" with your email address.
Julius de Kempenaer
Senior Technical Analyst, StockCharts.com
Creator, Relative Rotation Graphs
Founder, RRG Research
Want to stay up to date with the latest market insights from Julius?
– Follow @RRGResearch on Twitter
– Like RRG Research on Facebook
– Follow RRG Research on LinkedIn
– Subscribe to the RRG Charts blog on StockCharts
Feedback, comments or questions are welcome at Juliusdk@stockcharts.com. I cannot promise to respond to each and every message, but I will certainly read them and, where reasonably possible, use the feedback and comments or answer questions.
To discuss RRG with me on S.C.A.N., tag me using the handle Julius_RRG.
RRG, Relative Rotation Graphs, JdK RS-Ratio, and JdK RS-Momentum are registered trademarks of RRG Research.
Julius de Kempenaer
Senior Technical Analyst, StockCharts.com
Creator, Relative Rotation Graphs
Founder, RRG Research
Host of: Sector Spotlight
Please find my handles for social media channels under the Bio below.
Feedback, comments or questions are welcome at Juliusdk@stockcharts.com. I cannot promise to respond to each and every message, but I will certainly read them and, where reasonably possible, use the feedback and comments or answer questions.
To discuss RRG with me on S.C.A.N., tag me using the handle Julius_RRG.
RRG, Relative Rotation Graphs, JdK RS-Ratio, and JdK RS-Momentum are registered trademarks of RRG Research.


