The financial sector is one of the stronger sectors at the moment. Opening up the Relative Rotation Graph showing the members of this sector against XLF (as the benchmark) shows a concentration of asset managers and banks with positive rotations that are either inside the leading quadrant or moving towards it.
One of the names that looks attractive at the moment is Citizens Financial Group (CFG).
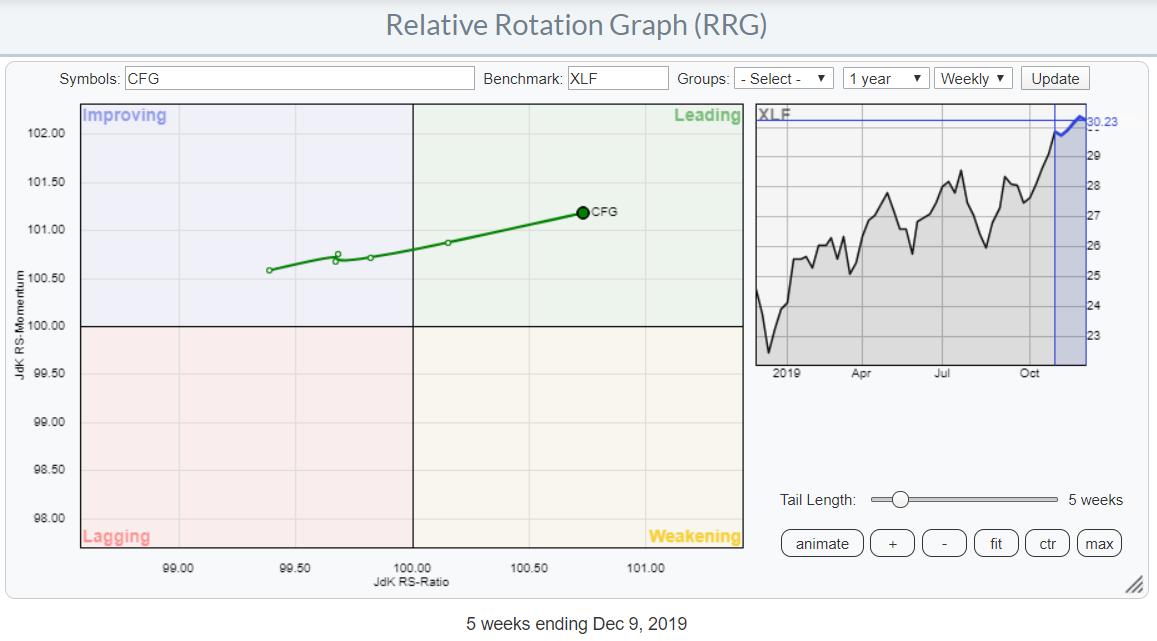
In particular, the rotation in combination with a lengthening of the tail looks strong. CFG is adding relative strength while maintaining relative momentum.
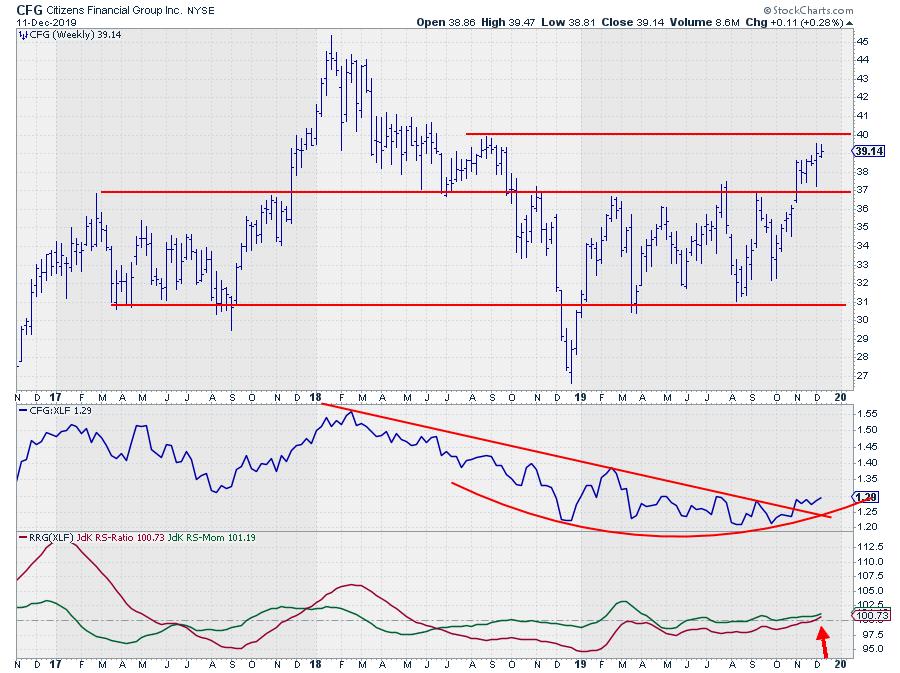
On the price chart, the break of overhead resistance near $37 was important, IMHO, and the stock now has more upside potential with a few intermediate resistance levels to conquer on the way up. An old high from 2018 of around $40 is the first hurdle to overcome.
The Relative Strength line is showing a nice gradual bottoming process which has recently come to an end, due to the upward break of the falling resistance line and the emerging series of higher highs and higher lows in RS. Most of the relative downtrend that started in the first half of 2018 was nicely caught by the RRG-Lines (RS-Ratio predominantly below 100).
The JdK RS-Ratio and JdK RS-Momentum lines are now simultaneously moving above the 100-threshold, pushing CFG into the leading quadrant. This makes CFG an interesting stock to monitor among financials.
--Julius
My regular blog is the RRG Chartsblog. If you would like to receive a notification when a new article is published there, simply "Subscribe" with your email address.
Julius de Kempenaer
Senior Technical Analyst, StockCharts.com
Creator, Relative Rotation Graphs
Founder, RRG Research
Want to stay up to date with the latest market insights from Julius?
– Follow @RRGResearch on Twitter
– Like RRG Research on Facebook
– Follow RRG Research on LinkedIn
– Subscribe to the RRG Charts blog on StockCharts
Feedback, comments or questions are welcome at Juliusdk@stockcharts.com. I cannot promise to respond to each and every message, but I will certainly read them and, where reasonably possible, use the feedback and comments or answer questions.
To discuss RRG with me on S.C.A.N., tag me using the handle Julius_RRG.
RRG, Relative Rotation Graphs, JdK RS-Ratio, and JdK RS-Momentum are registered trademarks of RRG Research.
Julius de Kempenaer
Senior Technical Analyst, StockCharts.com
Creator, Relative Rotation Graphs
Founder, RRG Research
Host of: Sector Spotlight
Please find my handles for social media channels under the Bio below.
Feedback, comments or questions are welcome at Juliusdk@stockcharts.com. I cannot promise to respond to each and every message, but I will certainly read them and, where reasonably possible, use the feedback and comments or answer questions.
To discuss RRG with me on S.C.A.N., tag me using the handle Julius_RRG.
RRG, Relative Rotation Graphs, JdK RS-Ratio, and JdK RS-Momentum are registered trademarks of RRG Research.


