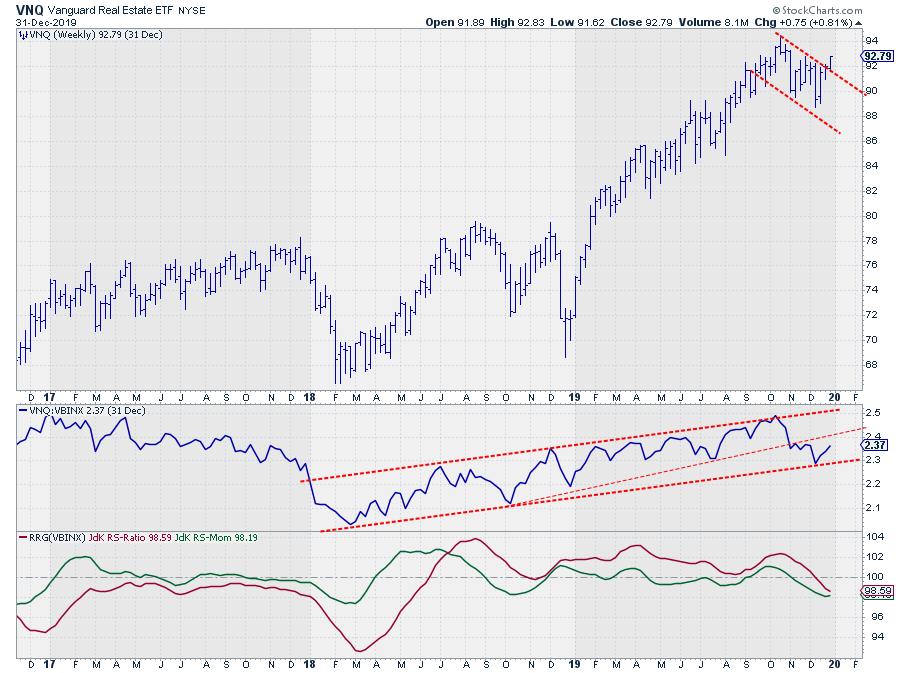
 Weekly price chart of VNQ with Relative Strength and RRG-Lines
Real Estate started to lose relative strength vs. VBINX in November, then crossed over into the lagging quadrant on the weekly Relative Rotation Graph in December. On the weekly RRG for asset classes, VNQ is still well inside the lagging quadrant and considered one of the weak(er) asset classes. However, something may be cooking.
On the weekly price chart above, VNQ just broke out of a downward sloping consolidation/correction in upward direction. On the weekly RS-Line, the recent low now connects with the lows that were formed in 2018, so that a meaningful trend line (support-) can now be drawn connecting those three lows.
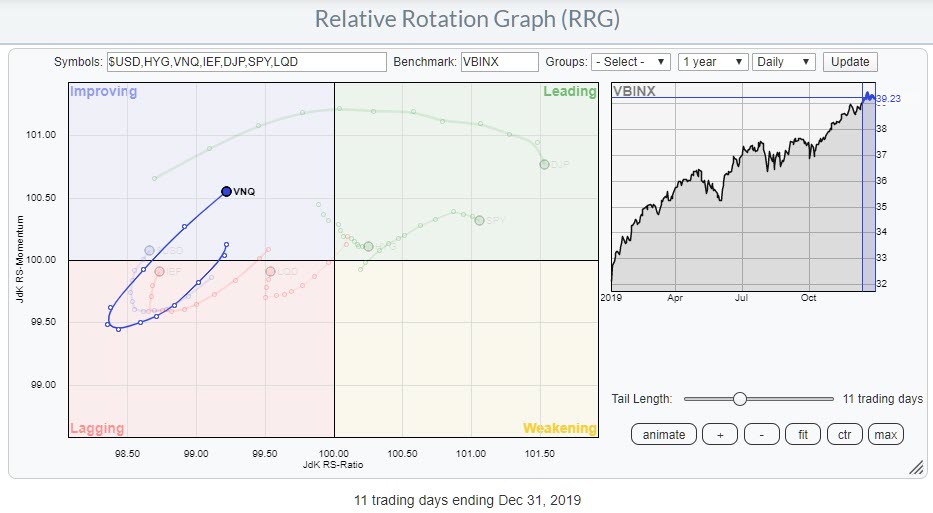 VNQ tail heading for Leading quadrant on daily RRG
This improvement is already becoming visible on the daily RRG, where VNQ rotated back from lagging into improving with an increasing RRG-velocity (distance on tail from day to day).
VNQ seasonality for January shows an outperformance over VBINX 60% of the time, with an average outperformance of 0.5%.
Although it is very early given the position on the weekly RRG, I think there are enough signs that warrant some extra attention for VNQ/Real Estate in the coming weeks. Will it be the surprise asset class for Q1-20?
--Julius
My regular blog is the RRG Chartsblog. If you would like to receive a notification when a new article is published there, simply "Subscribe" with your email address.
Julius de Kempenaer
Senior Technical Analyst, StockCharts.com
Creator, Relative Rotation Graphs
Founder, RRG Research
Want to stay up to date with the latest market insights from Julius?
– Follow @RRGResearch on Twitter
– Like RRG Research on Facebook
– Follow RRG Research on LinkedIn
– Subscribe to the RRG Charts blog on StockCharts
Feedback, comments or questions are welcome at Juliusdk@stockcharts.com. I cannot promise to respond to each and every message, but I will certainly read them and, where reasonably possible, use the feedback and comments or answer questions.
To discuss RRG with me on S.C.A.N., tag me using the handle Julius_RRG.
RRG, Relative Rotation Graphs, JdK RS-Ratio, and JdK RS-Momentum are registered trademarks of RRG Research.
Julius de Kempenaer
Senior Technical Analyst, StockCharts.com
Creator, Relative Rotation Graphs
Founder, RRG Research
Host of: Sector Spotlight
Please find my handles for social media channels under the Bio below.
Feedback, comments or questions are welcome at Juliusdk@stockcharts.com. I cannot promise to respond to each and every message, but I will certainly read them and, where reasonably possible, use the feedback and comments or answer questions.
To discuss RRG with me on S.C.A.N., tag me using the handle Julius_RRG.
RRG, Relative Rotation Graphs, JdK RS-Ratio, and JdK RS-Momentum are registered trademarks of RRG Research.


