ROKU was a big favorite of growth investors in 2019, as the stock idled from flat to full speed for most of the year. Yet in the last quarter, while everything else was accelerating, ROKU has underperformed. So a big question going into 2020 is whether to fold or hold ROKU?
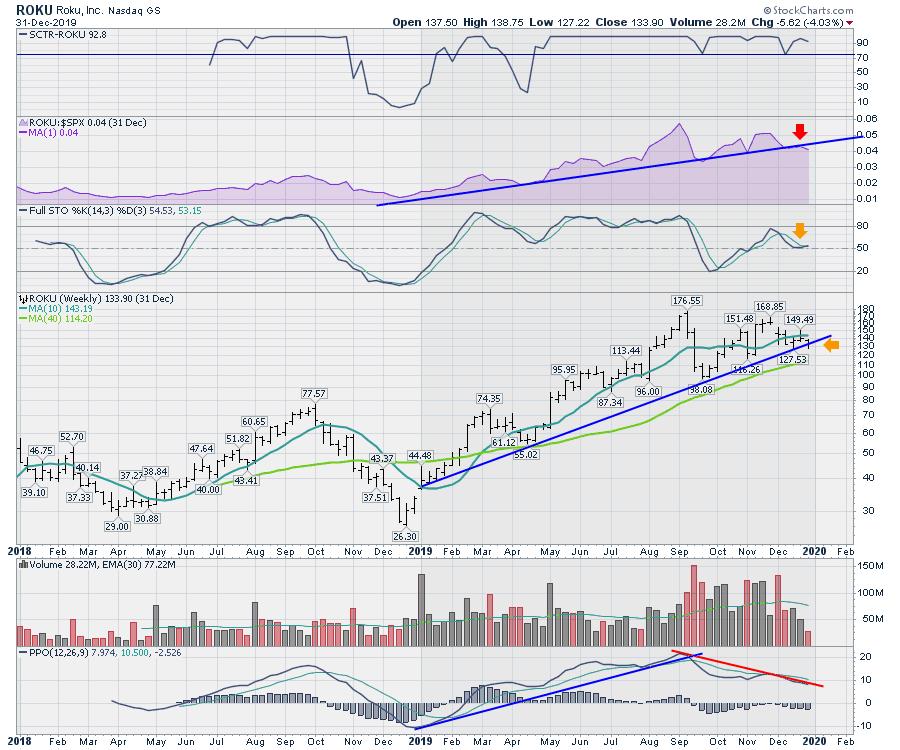
Here's how I look at the stock chart. First of all, the SCTR suggests this is one of the best stocks to own in 2019. The SCTR has stayed above 75, which is in the top quartile of all the stocks in its peer group. I find the SCTR more helpful for entry than exits. Currently it is still strong, but let's look at some of the other indicators for ideas on when to exit.
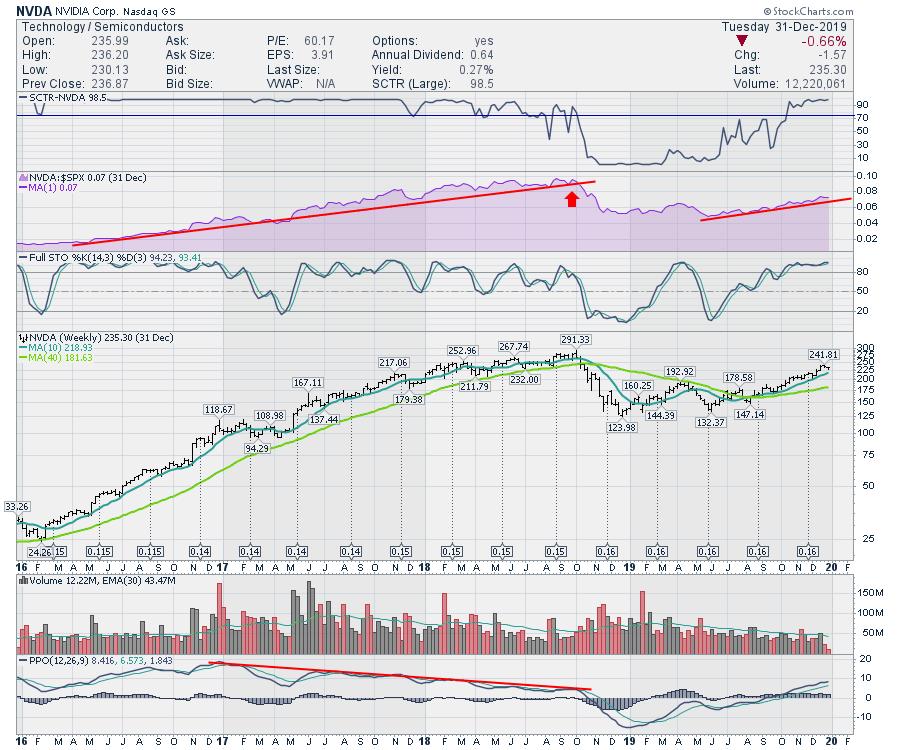
One of the strongest clues for me is the relative strength (in purple) breaking down below the trend. Why is this important? When it is rising, it is outperforming, so we want the uptrend to continue. For me, the perspective is why are investors not continuing to buy the stock and keep the uptrend going? If the $SPX is the average performance of 500 stocks, and this former superstar stops outperforming the average, that is a concern. Finding a break on a weekly chart is important to me. A break in the relative strength trend on a big winner is usually close to the final high for a while.

An example of that might be the price action of Nvidia (NVDA):
Returning to the ROKU chart below, there are some other signals that are not sell signals but instead cautionary signals. The weekly full stochastic couldn't get back above 80 and is now trying to hold above 50. A failure to hold there would probably show the stock breaking down even more. On price, the year-long trend line is being threatened and, this week, it sits on the trend line to end the calendar year.
The PPO shows momentum waning. In October 2018, the PPO was trending down as the broad market was dropping. Now, momentum is waning (PPO trending down) as the broad market keeps moving higher. That is not bullish on its own, but particularly concerning considering almost everything is running higher right now.
All that is to say it might be time to change the picture from ROKU. It wouldn't be my choice to own it here with the weak technicals.
This is the last chance before the Market Vision 2020 event with all your favorite StockCharts authors! If you would like more information, follow this link! It all happens on Saturday, January 4th. With the great returns from 2019, this might be a good time to investigate some of your favorite technical analysts from StockCharts!
Good trading,
Greg Schnell, CMT, MFTA
Senior Technical Analyst, StockCharts.com
Author, Stock Charts For Dummies
Want to stay on top of the market's latest intermarket signals?
– Follow @SchnellInvestor on Twitter
– Connect with Greg on LinkedIn
– Subscribe to The Canadian Technician
– Email at info@gregschnell.com


