The selling that we saw last week was long overdue. Many are panicking over the coronavirus, which is easy to do when it's the only thing that the media is covering. After all, there has to be some fundamental reason that will lead to the next market collapse, right? I'm not downplaying this virus at all; it is definitely a health emergency and one that shouldn't be taken lightly. But I'm not buying the sudden association between the virus and stock market action. The media needed a topic that sells and a rapidly-spreading virus does the trick.
The consolidation and selling that we've experienced has had MUCH more to do with technical and historical headwinds. I began seeing warning signs two weeks ago and wrote about it in my January 17th ChartWatchers article, titled "The Masses Are Growing Too Bullish; I Smell A Short-Term Top". This article focused on one of the warning signs, which was an extremely high bullish sentiment reading. The 5-day moving average of the equity-only put call ratio ($CPCE) reached levels only seen three other times in the last 15 years. EVERYONE was buying calls, believing the market couldn't go anywhere but up. That was the top. Two days earlier, on January 15th, I wrote to EarningsBeats.com members and announced a rare and impromptu webinar, "Market Warning Signs," to discuss several topping signs. These included, in no particular order, (1) the equity-only put call ratio, (2) a higher VIX with a higher S&P 500 (increasing expected volatility), which is almost always associated with a subsequent market drop, (3) one-month leadership from defensive sectors, especially utilities (XLU) and real estate (XLRE), (4) the end of the most bullish historical period of the year (October 27th close through January 18th close), (5) negative divergences among major indices and key sectors over multiple time frames, (6) overbought conditions and (7) the breakout in treasury prices and corresponding breakdown in treasury yields.
Oh never mind. I forgot. I just read it was the coronavirus.
There's a very, very good chance that we won't be hearing anything about the coronavirus in a month or two, as U.S. major indices set more all-time highs. The real headline never gets discussed. "Earnings growth in a historically-low interest rate environment with below-target inflation levels." That's the real headline and the thing that will power global markets higher later this year, and for years to come. When companies beat earnings expectations and raise guidance, those future earnings become EXTREMELY valuable when discounting them back to present value using interest rates near zero. That's why the stock market has been melting up. The "below-target inflation levels" have been overlooked for the past year. Even the Fed couldn't get it right for awhile. The Fed will not raise rates anytime soon and I believe they might even cut again this year. Last week, the Q4 GDP was released. While most likely focused on the 2.1% rate of growth, the PCE price index, stripped of volatile food and energy, rose 1.3% - well below the Fed's 2% target level. The way to inflate the economy is to cut rates, which weakens the dollar, prompting higher commodity prices.
So the key takeaway is that the Fed will remain very accommodative in a low-interest-rate environment, with moderate earnings growth (stellar earnings growth in some cases like AAPL and TSLA). I haven't seen this environment in my lifetime. It's one that will carry stock prices much, much higher this decade. This isn't rocket science. If you can invest your money in a company like AAPL or TSLA with huge earnings growth or invest in a 10 year treasury yielding 1.52%, what will most investors do? Why do you think AAPL is up 50% since October and why TSLA has tripled over the same time frame? (TSLA also had 21% of its float short in December, so that stock is being driven higher by multiple factors, especially those holding the stock short and having to panic buy.)
Last week, earnings in key areas leading the market higher EXPLODED. This includes AAPL in computer hardware ($DJUSCR). But there have been huge earnings reports in semiconductors, from INTC to LRCX to TER to QRVO to CRUS. The list is growing. I have another that will be reporting results on Monday. Here's the chart:
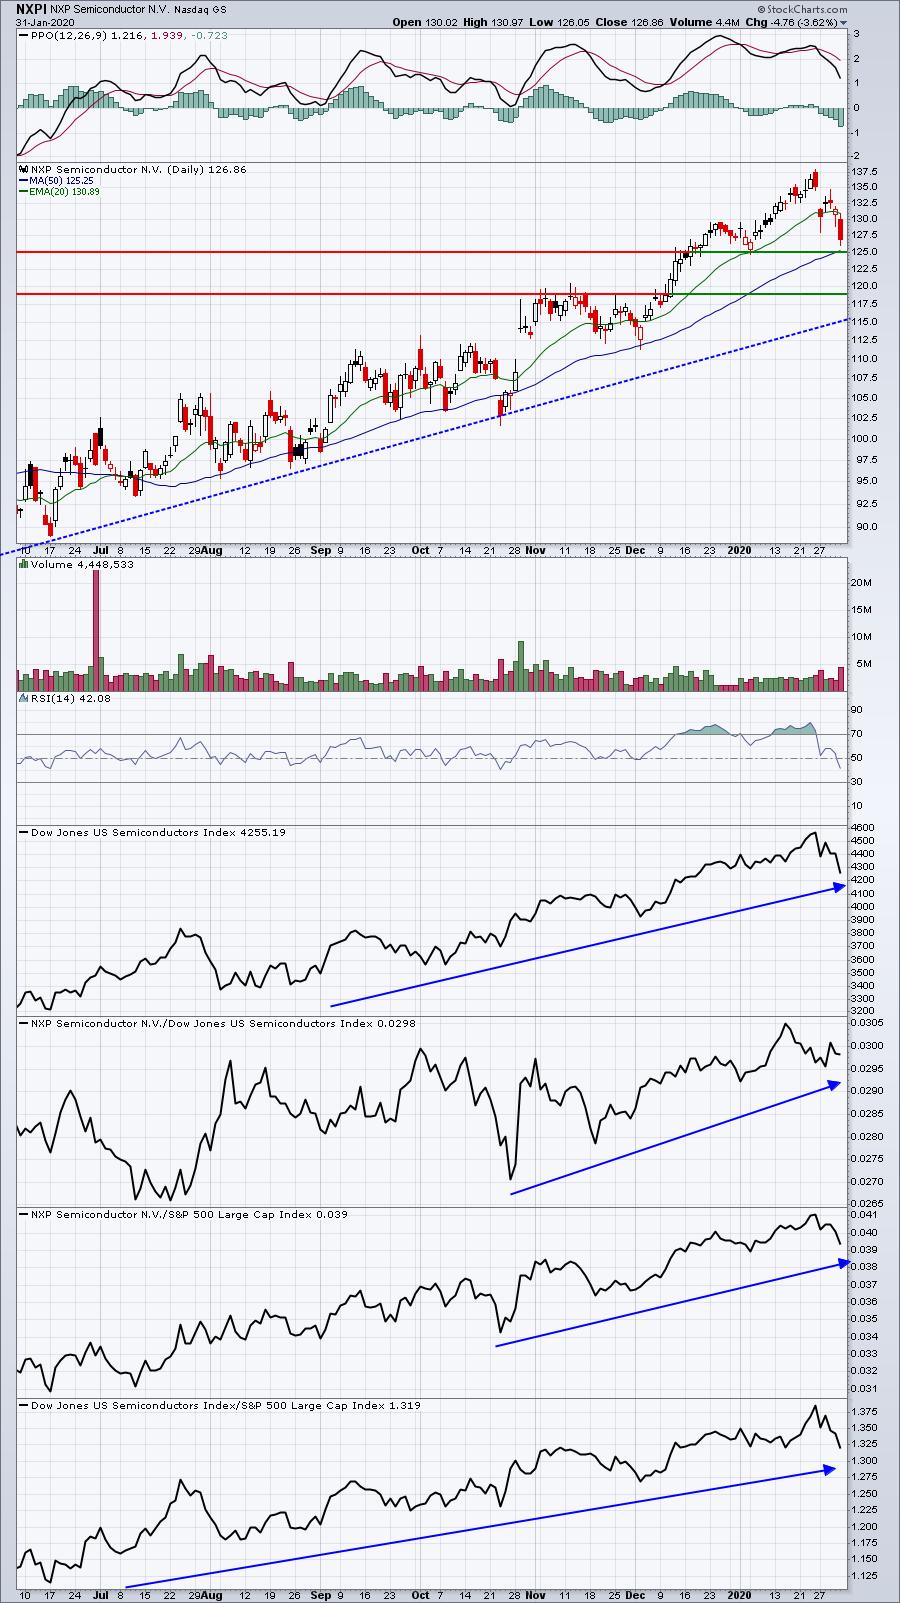
This is my perfect setup. One of the strongest industry groups and one of the strongest stocks within that industry group. I suspect NXPI will deliver excellent results on Monday. But, like many other stocks this past week, it could be a "buy on rumor, sell on news" scenario.
Later today, I'm hosting a 2pm EST webinar. Those attending will receive a copy of my Strong Earnings ChartList, a powerful list of companies that have beaten both revenue and EPS estimates in their latest quarterly reports. If you're a StockCharts.com EXTRA member or above, you'll be able to download this ChartList into your account in 10 seconds or less. I will show you a new feature at StockCharts that is absolutely amazing! If you're not already a StockCharts.com member, be sure to sign up for your free 30-day trial and then join me after 1:30pm EST today using the following link: https://zoom.us/j/532677405
In addition to providing you my Strong Earnings ChartList (and showing how to quickly download it into your account), I'll also provide you the best and worst earnings setups this week. I did this last week and the results were incredible. I'll share those results during today's webinar as well. The webinar is 100% free, but we'll add you to our free EB Digest newsletter (which is sent out 3x per week on Mondays, Wednesdays and Fridays), which illustrates the importance of earnings and relative strength, if you're not already a subscriber.
Happy trading!
Tom


